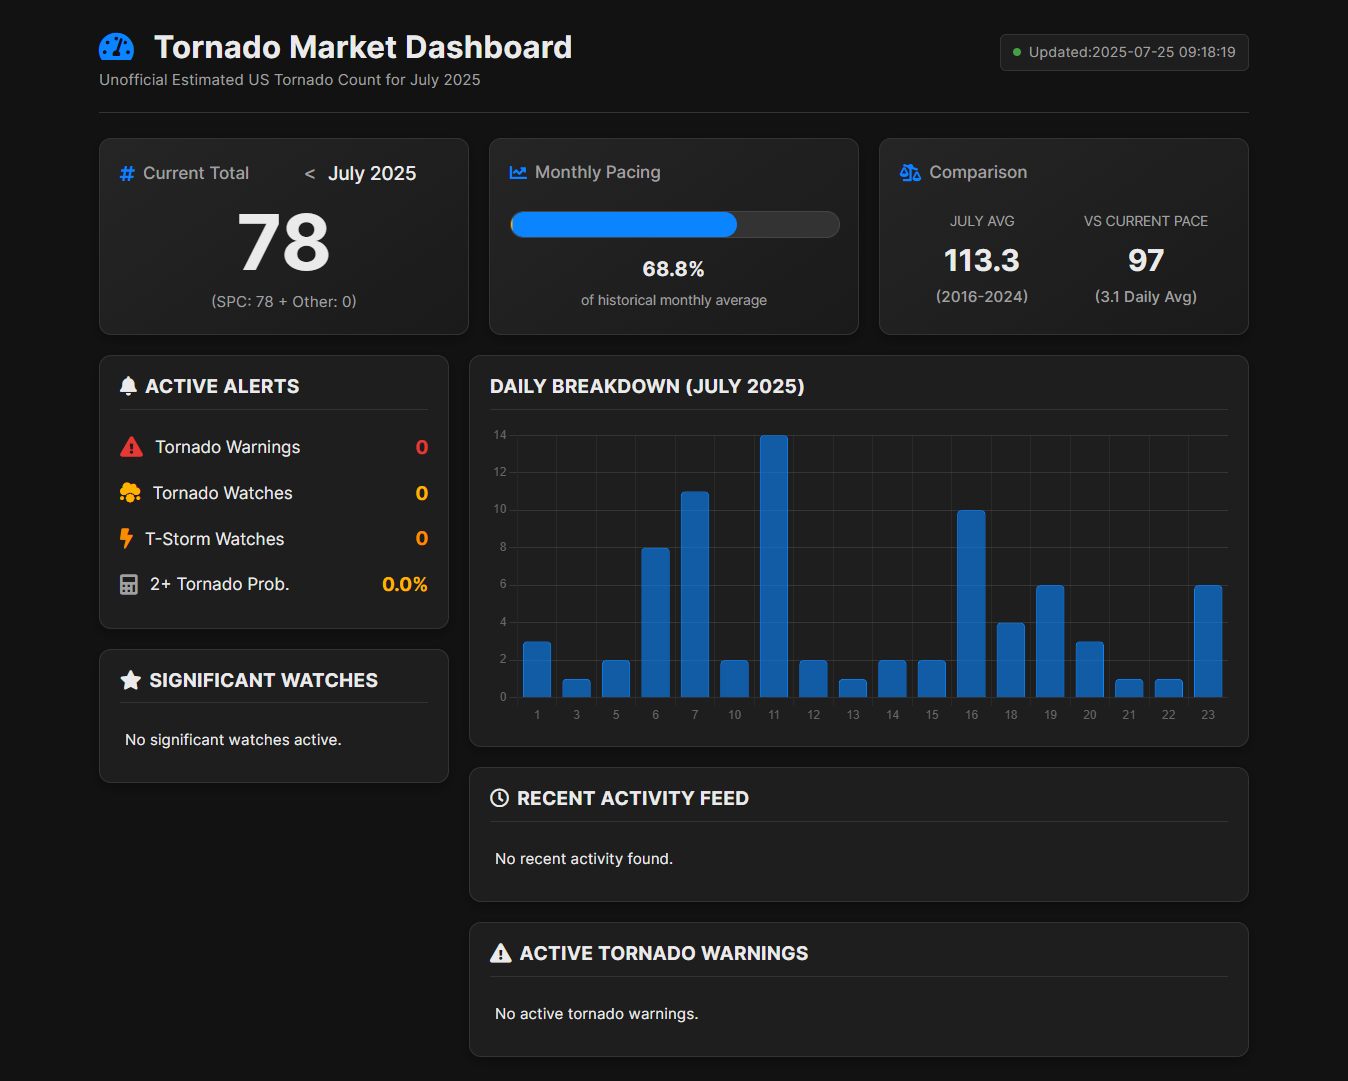
A Plan for Every Trader

From essential speed advantages to professional-grade analytics, Wethr.net gives you the tools to win.

Core Features Included in All Paid Plans

3 Minute Head Start

Paid users get temperature dashboard updates a full 3 minutes ahead of free users.

Alerts Ticker

Stay ahead of important upcoming observations with an alerts ticker on the temperature dashboard.

Multi-Station Snapshot

Track multiple markets of interest from a single fully customizable interface.

Unlock Professional Power

Go beyond the basics with a suite of advanced tools designed for serious traders who demand the ultimate edge.

Tornado Dashboard

The Wethr.net Tornado Dashboard breaks down key metrics and provides historical insight to help you properly value brackets early on.

The dashboard automatically updates in near real-time to provide you with an edge in those final hours.

Locked Sign Up

Similar Days Tool

This tool digs through Wethr.net data to find days that are similar to the current day. It then uses that data to forecast what the current day might look like.

Use the "Hours to Compare" filter to broaden or narrow the scope of your comparison.

Locked Sign Up

Weather Model Explorer

Analyze existing weather models by measuring their accuracy both generally and at the peak temperature of the day. Analyze a single day or backtest over a longer time period using Aggregate Mode.

In "Manage" mode, Create new "blended" models by mixing and matching existing models at different weights. Create correction profiles for existing models by applying modifcations when certain conditions are met.

View the output of your custom blended and modified Correction Profiles in Prediction Mode, which allows you to see your custom model forecast charted along with the existing standard models.

Locked Sign Up

Dashboard Model Table

View key model data from regularly updated model runs, directly on the temperature dashboard. Data points for the current day include model high temps, model high of day times, and model pacing as compared to real-world observations.

Locked Sign Up

Dashboard Model Chart

This chart, which appears under the Model Table on the temperature dashboard, shows a wide range of constantly updated weather model forecasts for the current day and into the future.

Locked Sign Up

NWS Forecast Evolution

These charts on the temperature dashboard track changes to the National Weather Service forecasts over time. Tracking these changes and charting them allows us to see how the forecast is evolving, adding valuable information to your decision making process.

Locked Sign Up

Neighbors Map

The Neighbors Map is an automatically updating map that shows the most recent observed temperture at surroundig stations, allowing you to see when temperature shifts are coming as they impact further away stations.

Locked Sign Up
Top