Your Analytical Edge, Explained
Every tool on the platform — what it does, why it matters, and which plan includes it.
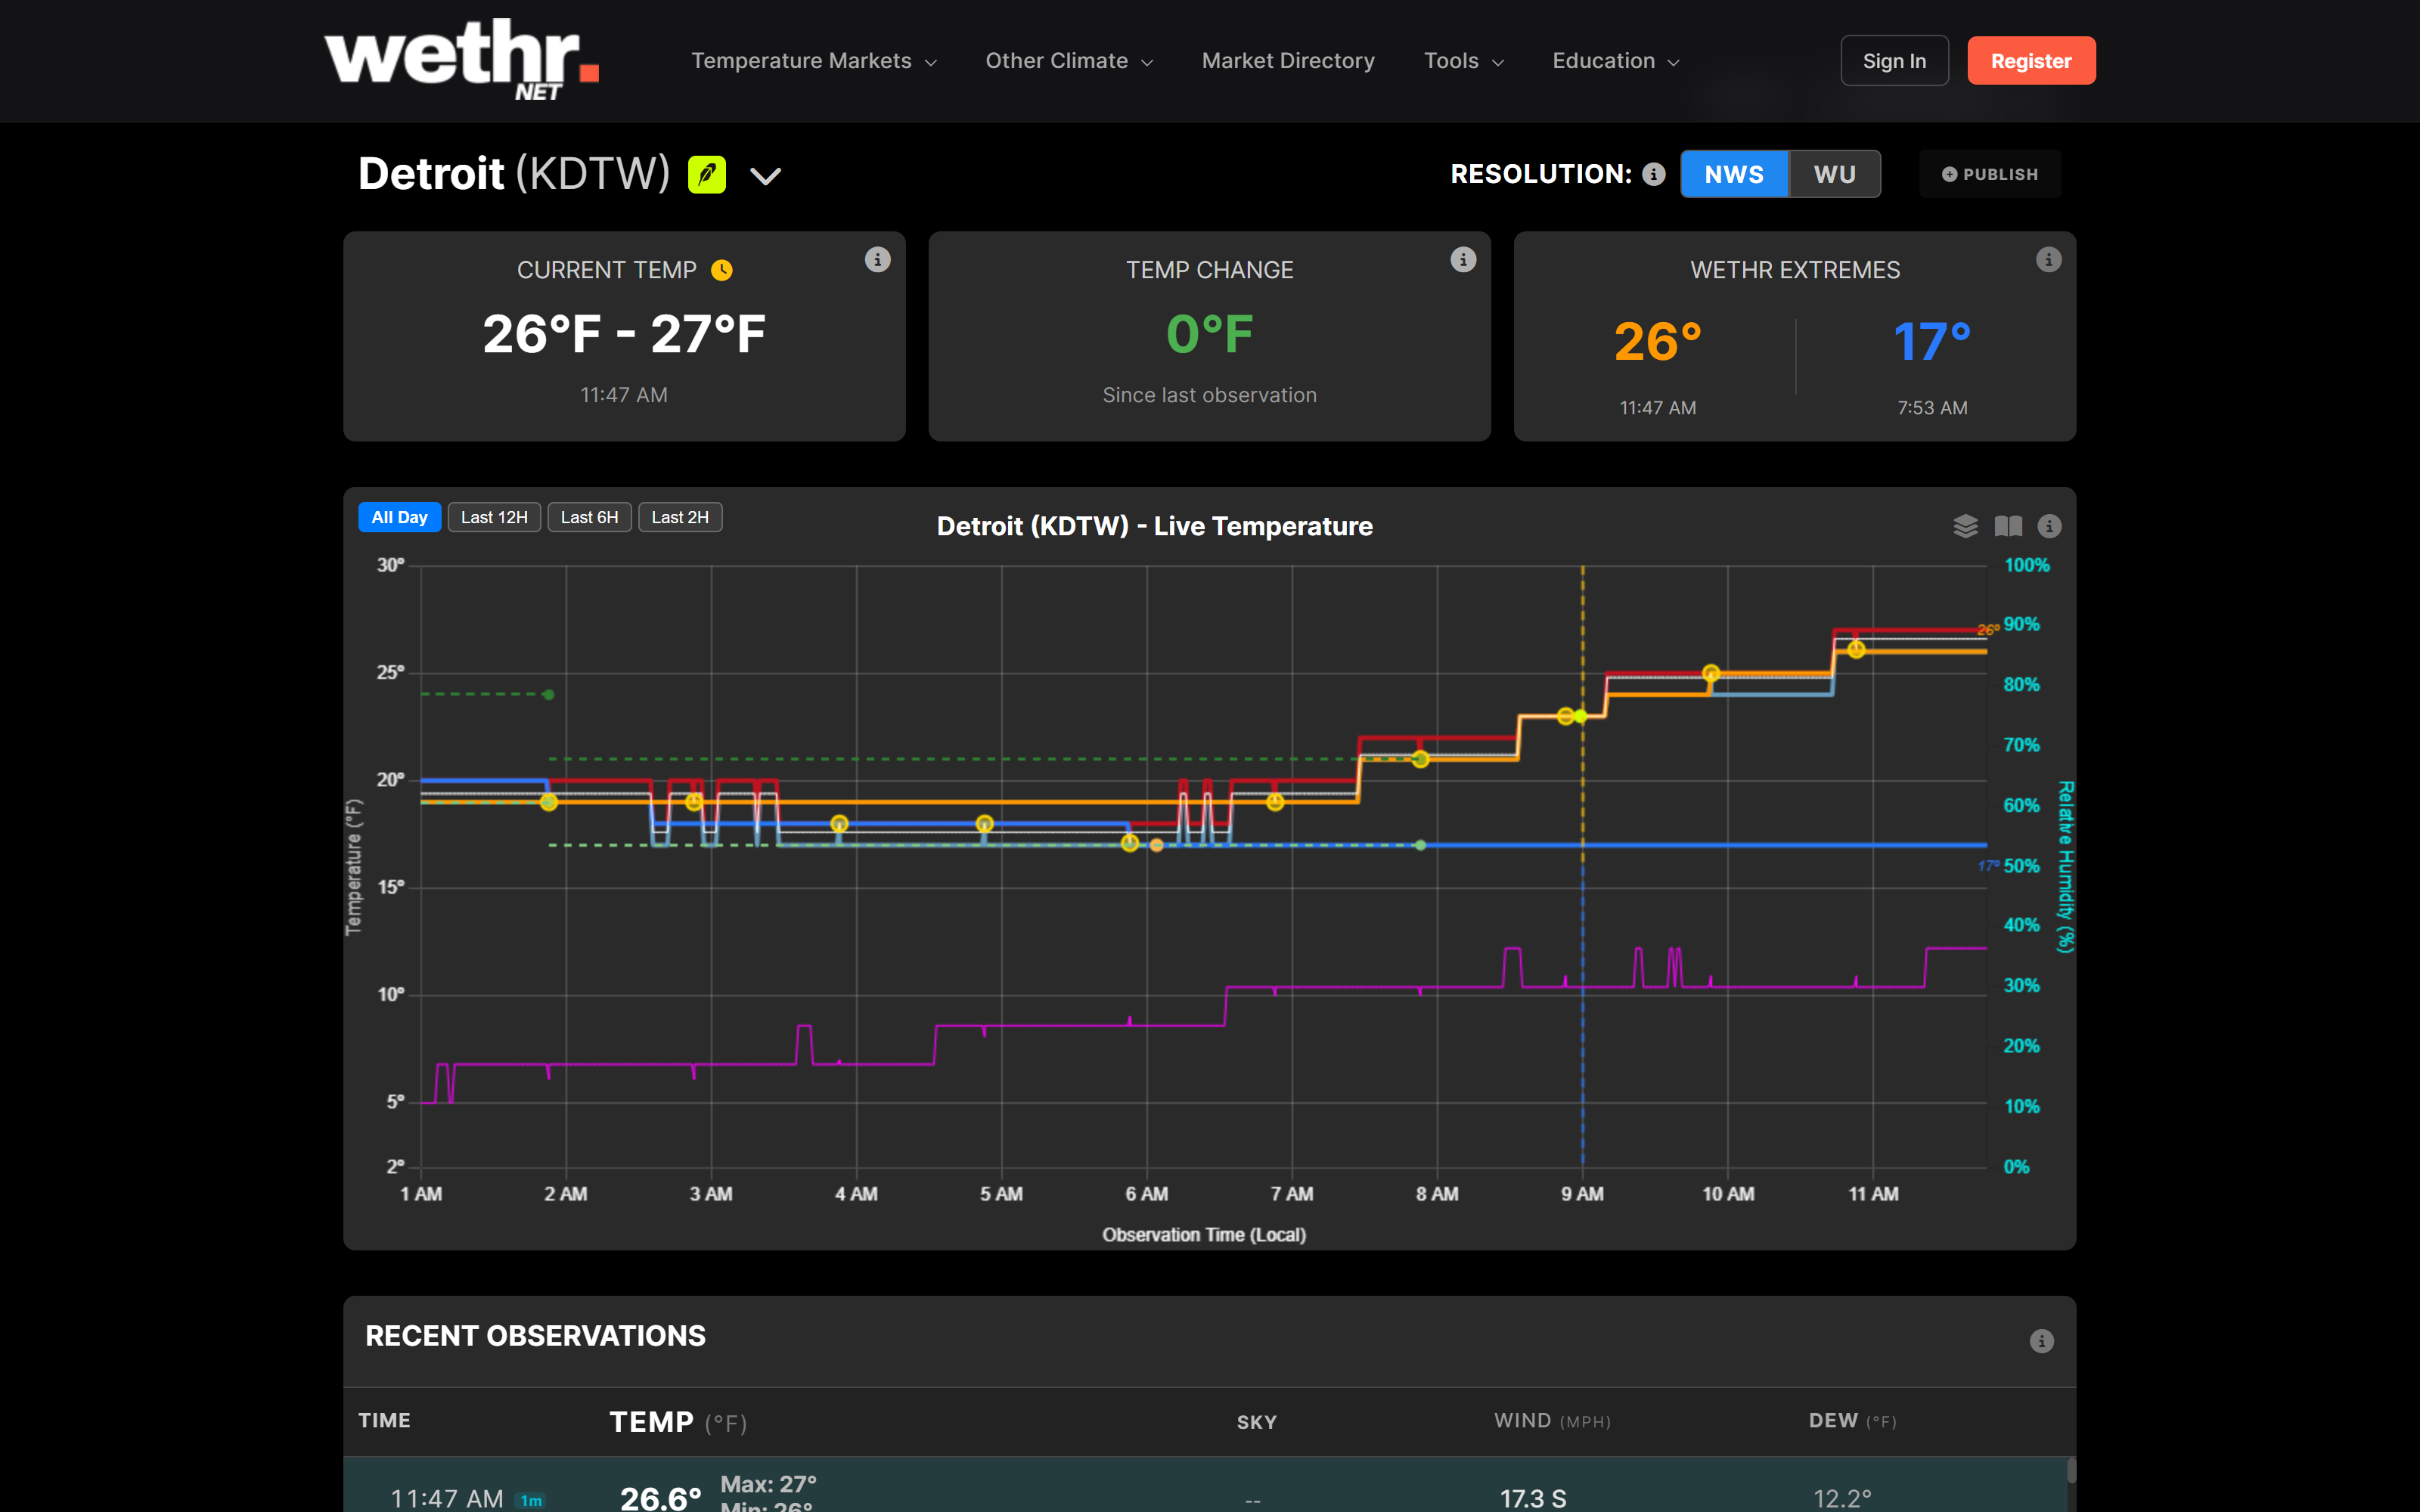
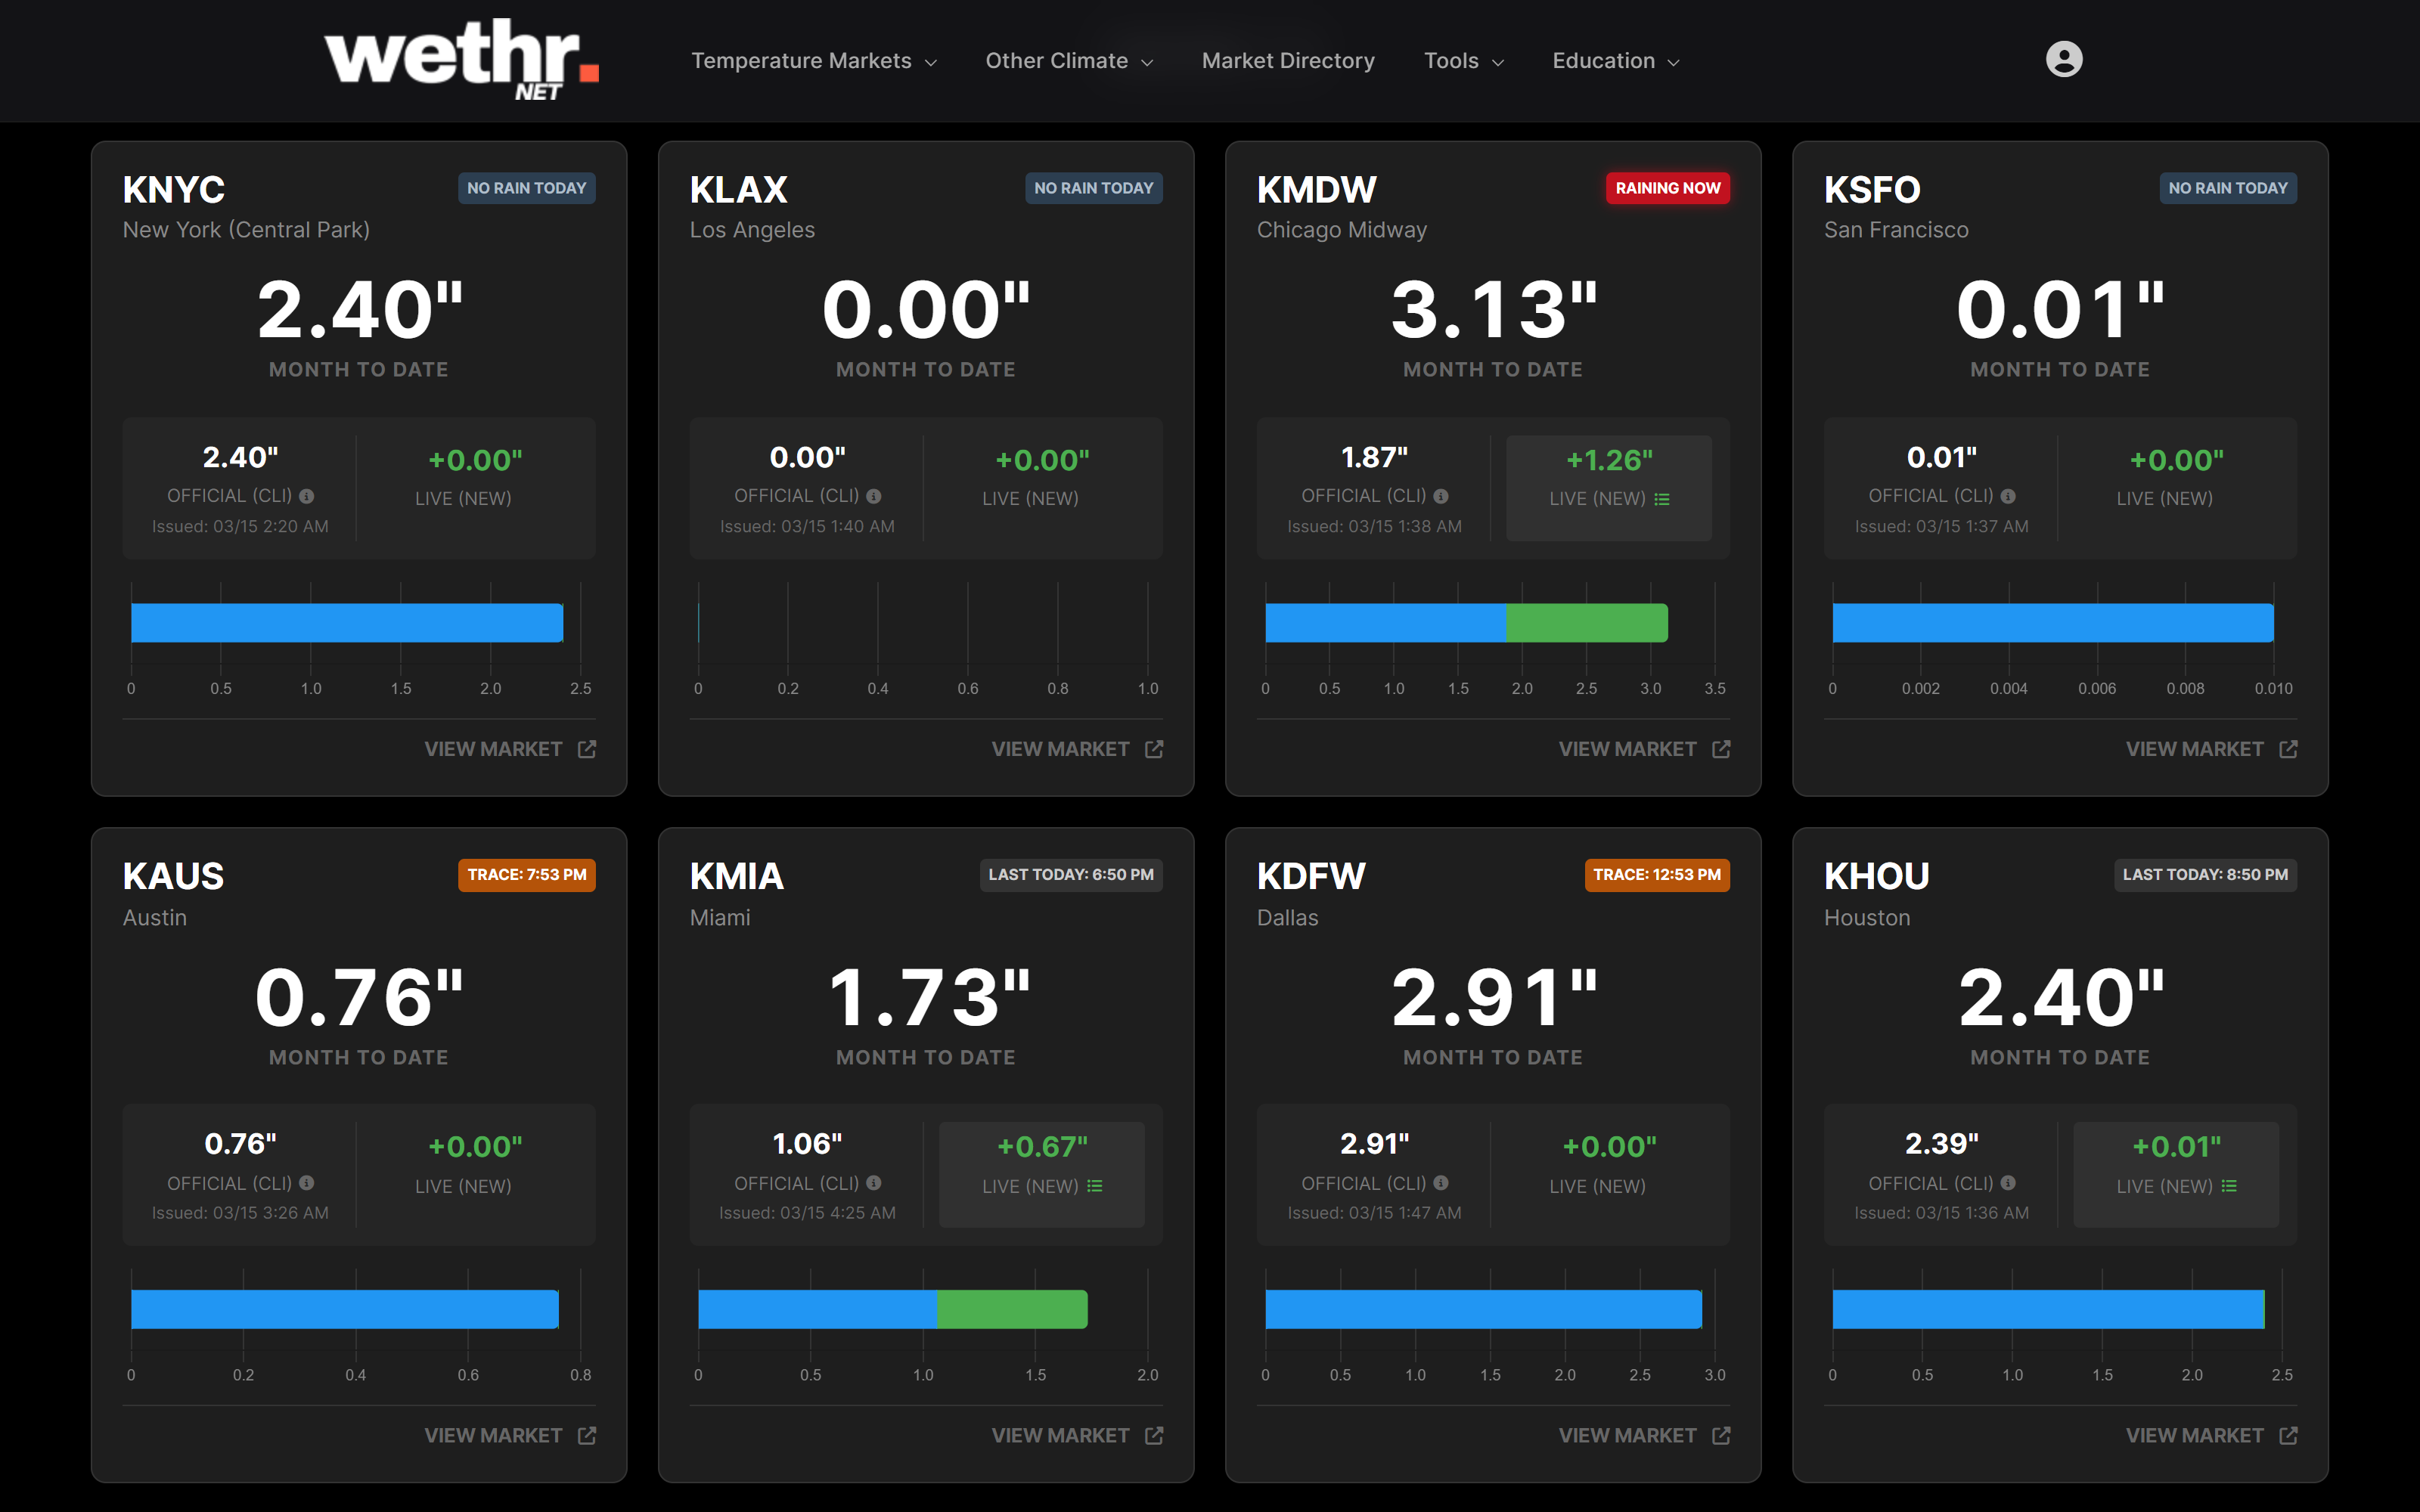
Your Dashboard
A clean, fixed-layout dashboard available to every user. Paid plans unlock additional widgets, tools, and data.
Everything in a predictable spot
Every Wethr.net user gets access to the Static Dashboard — a clean, fixed layout with all the essentials in one place. Paid plans unlock model data, alerts, and more.
Speed & Awareness
Everything from Free, plus a fully customizable dashboard, faster data, zero ads, and multi-station monitoring.
Drag, drop, and resize — build the dashboard you want
The Widget Dashboard lets you fully customize your layout. Drag, drop, and resize every panel to build a workspace that fits how you trade.
See new observations 3 minutes before unpaid Wethr.net users
When a new temperature observation hits Wethr.net, paid users see it immediately. Free Wethr.net users see the same data on a 3-minute delay.

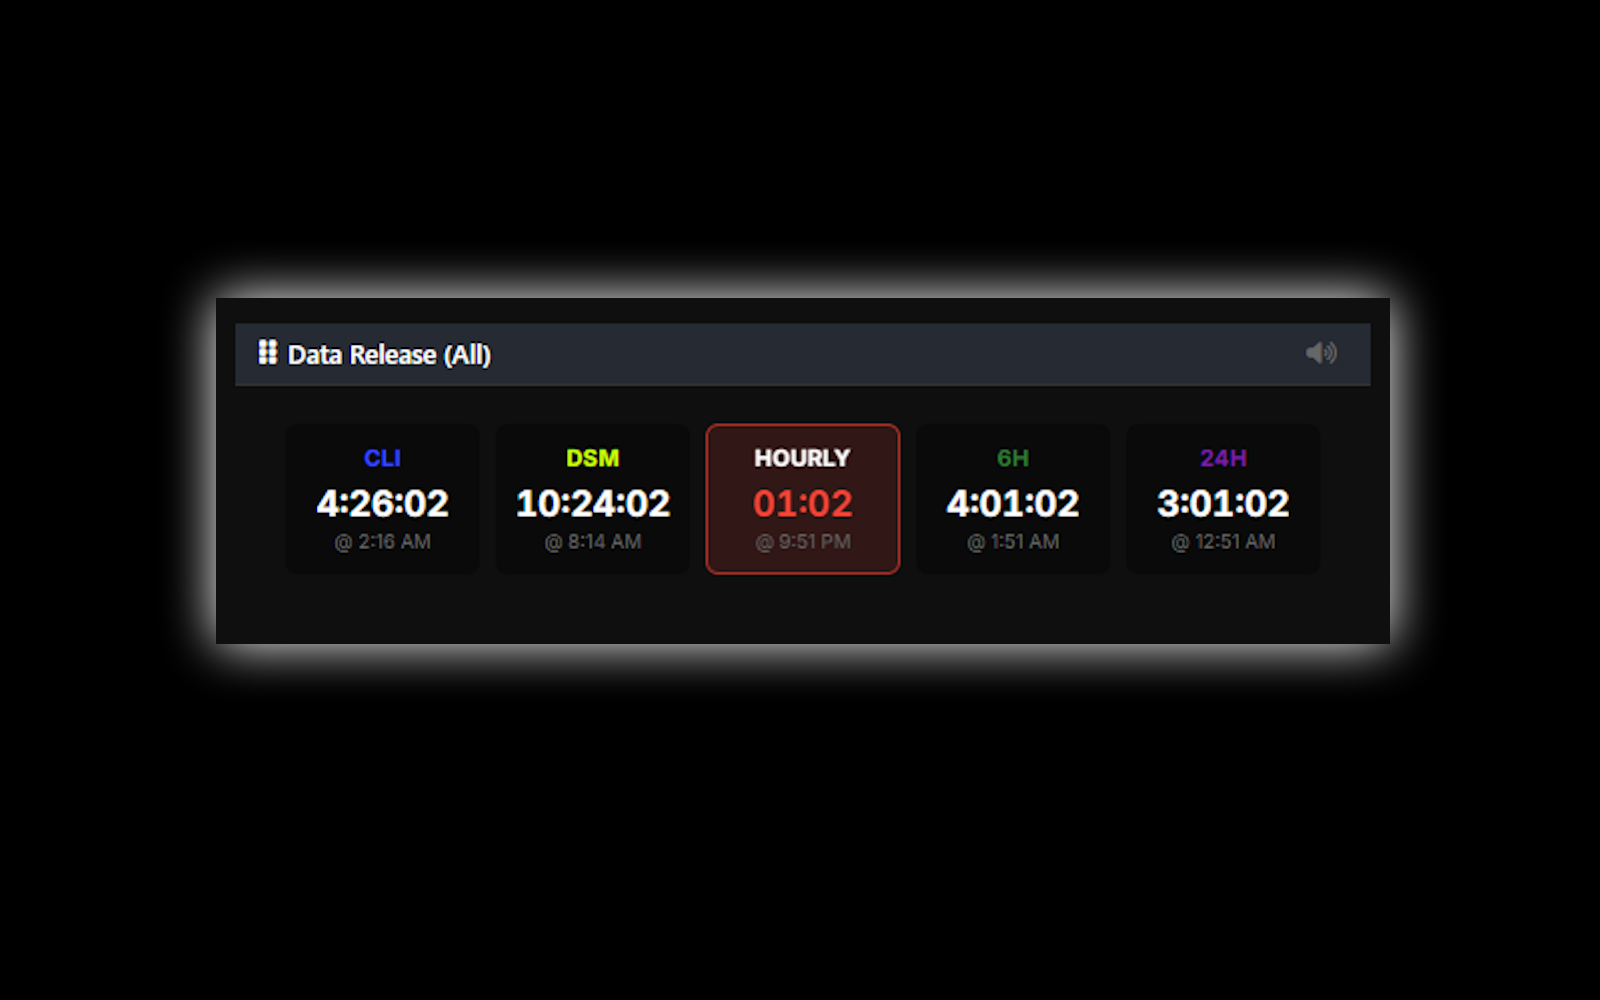
Live countdown timers for upcoming observation
The Data Release Schedule shows live countdowns for CLI, DSM, Hourly, 6-Hour, and 24-Hour observations.
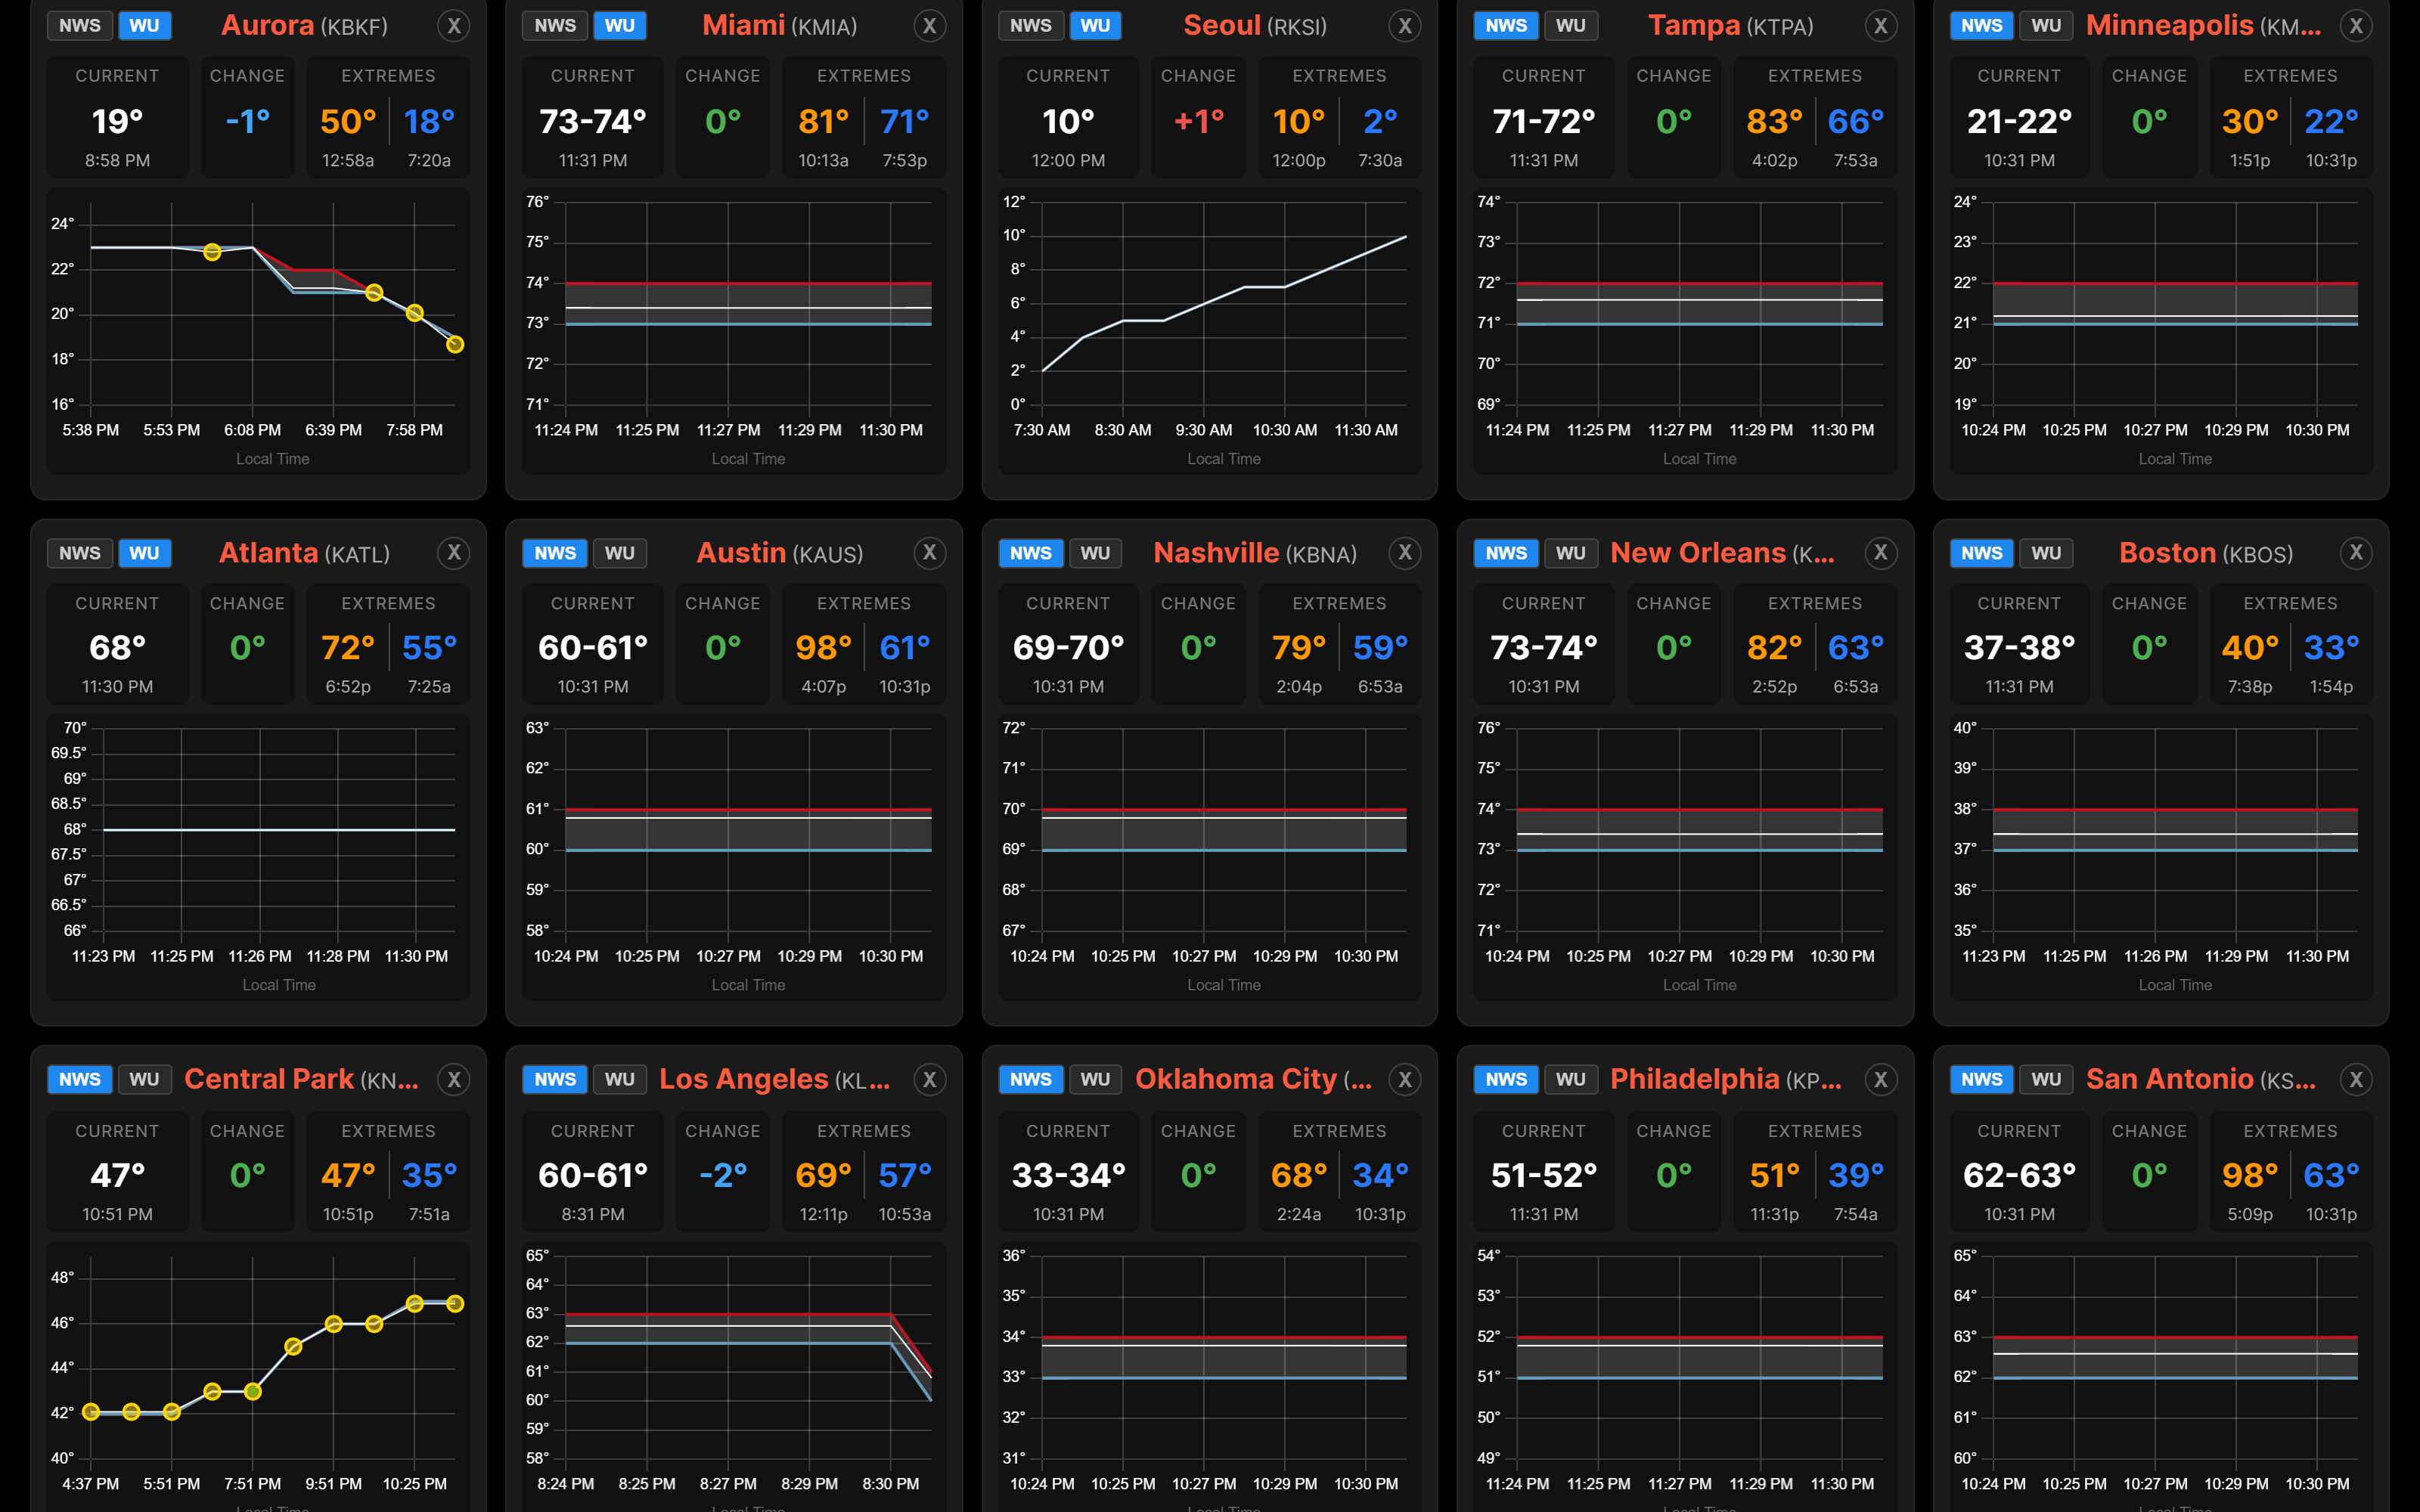
All your markets on one screen
The Multi-Station Dashboard is a third dashboard mode that lets you monitor every station you care about in a single view — no tab switching.
No ads. No distractions. Just data.
Every paid plan removes all advertisements from the platform. Your dashboards, charts, and tools load faster and display without interruption.
That's just the basics.
Professional unlocks the full analytical suite — model tools, live dashboards, and API access.
The Full Analytical Suite
Everything in Basic, plus model analytics, live tracking dashboards, historical analysis, and complete API access.
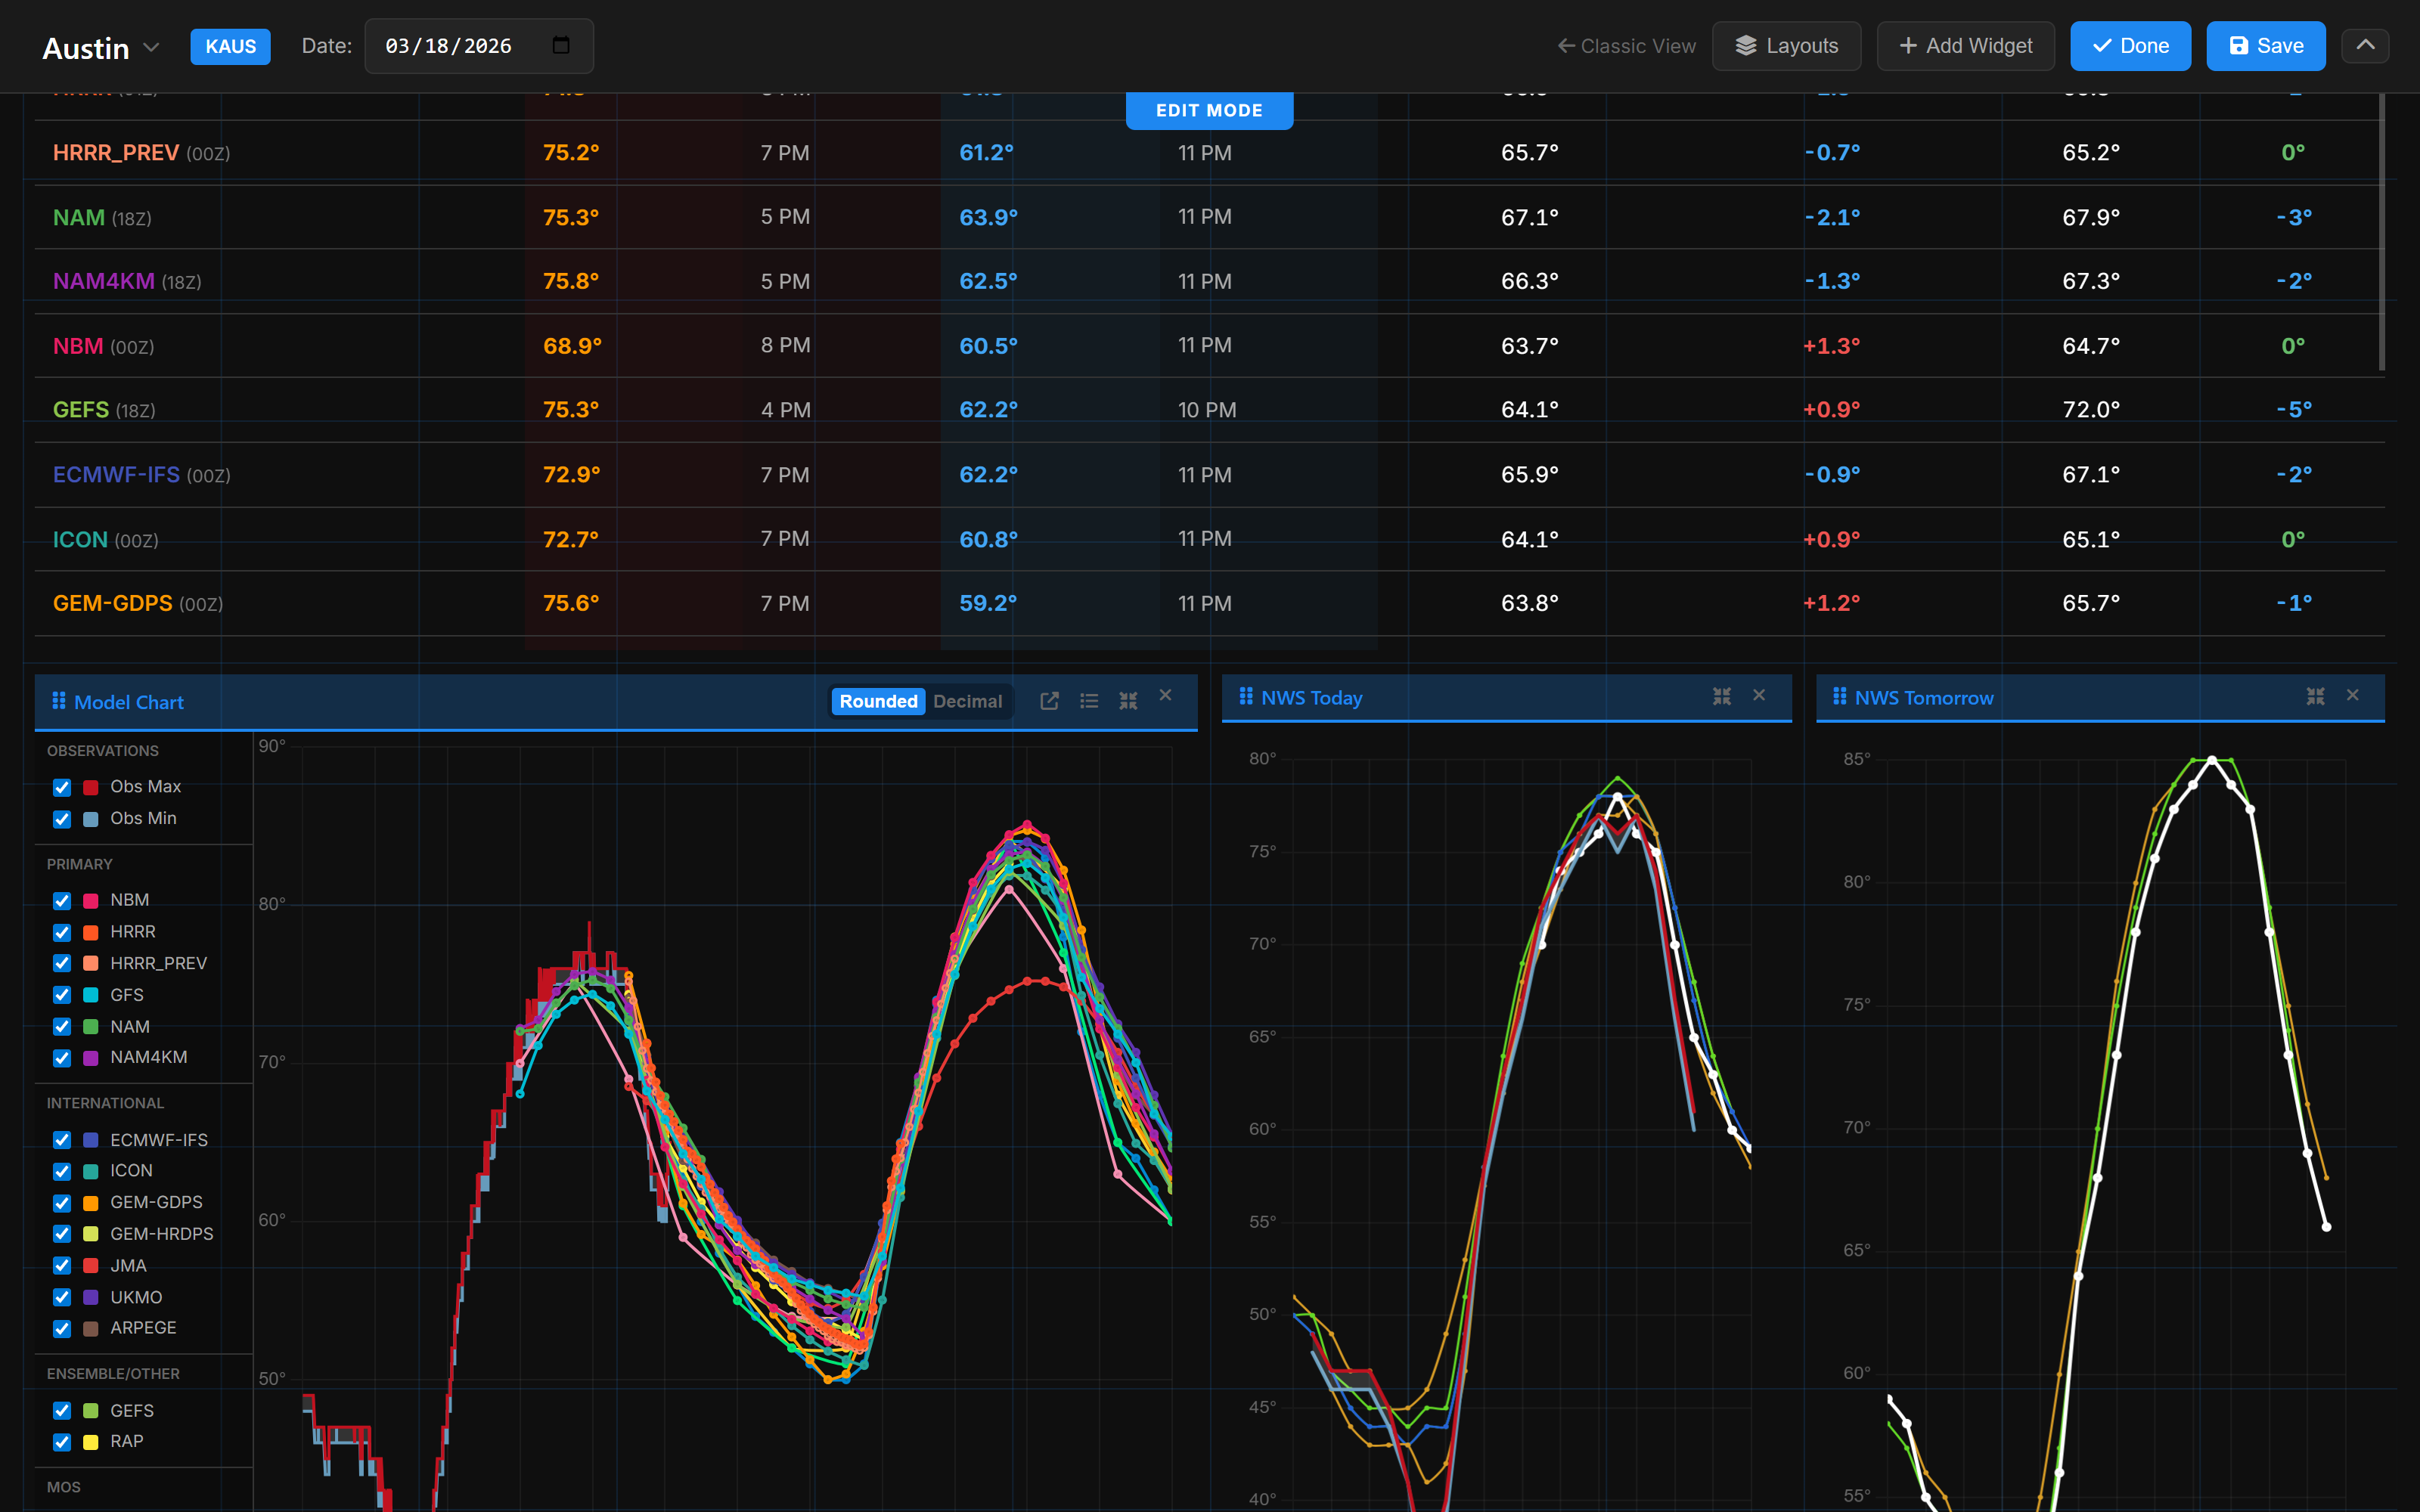
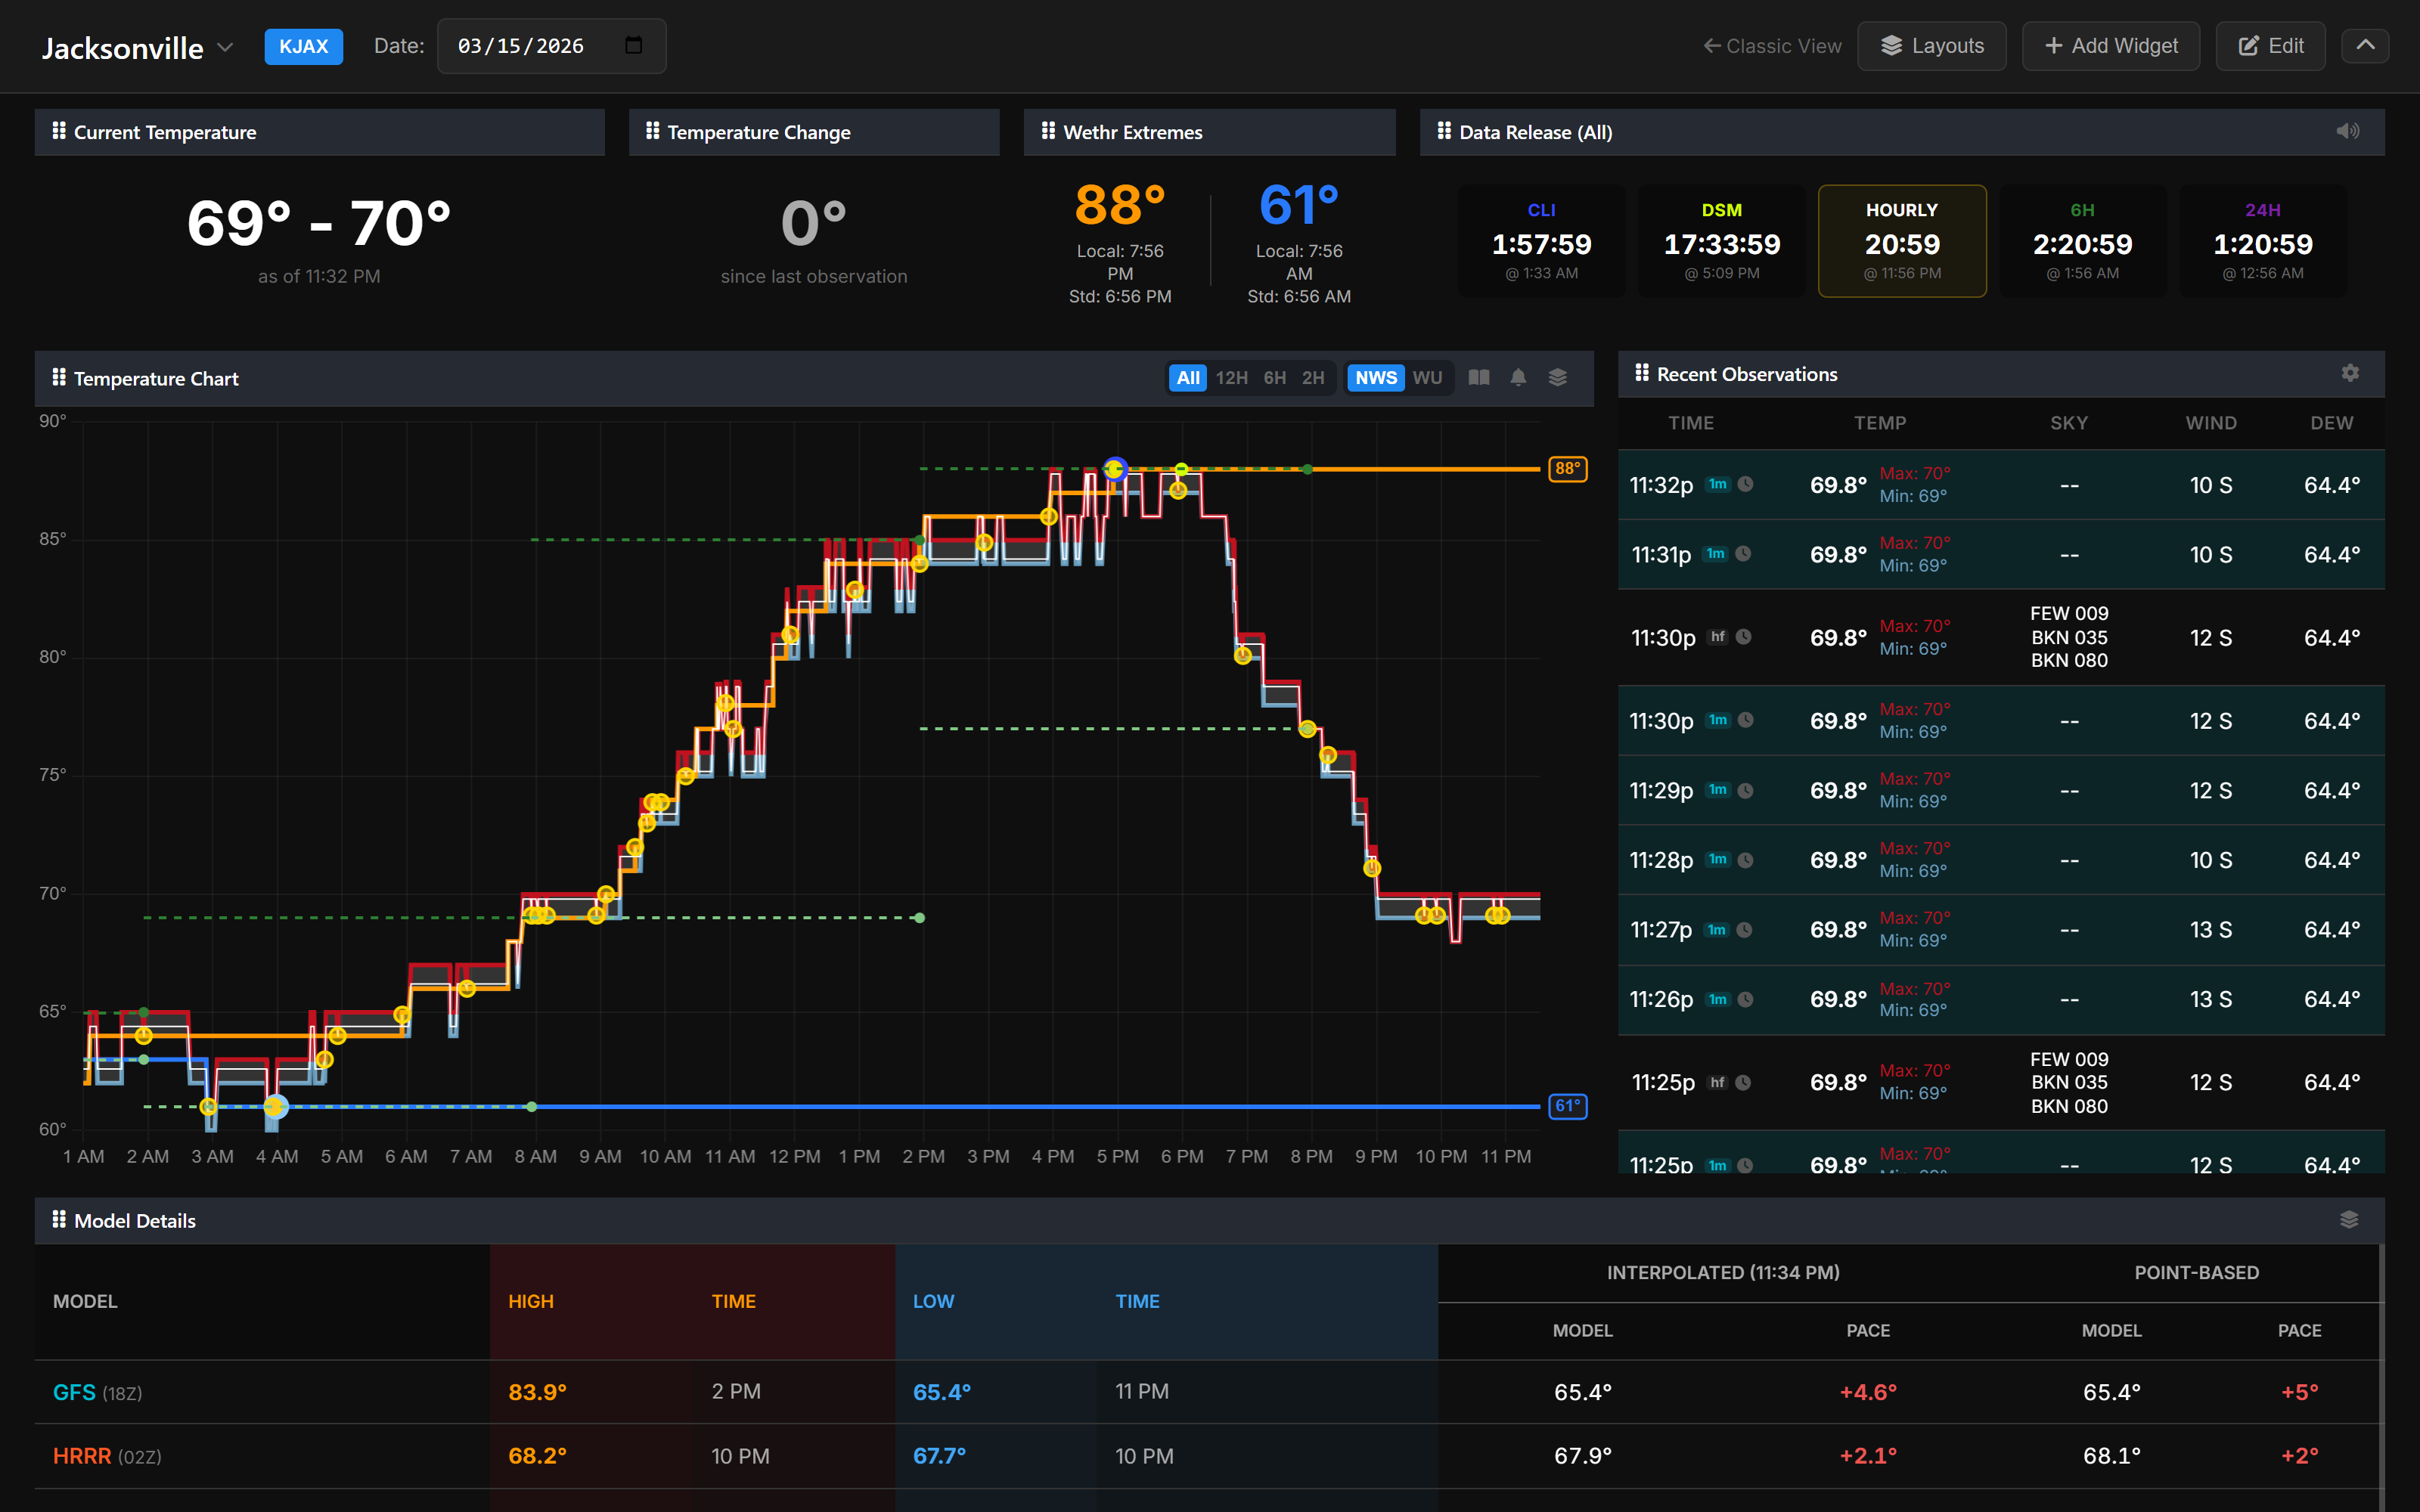
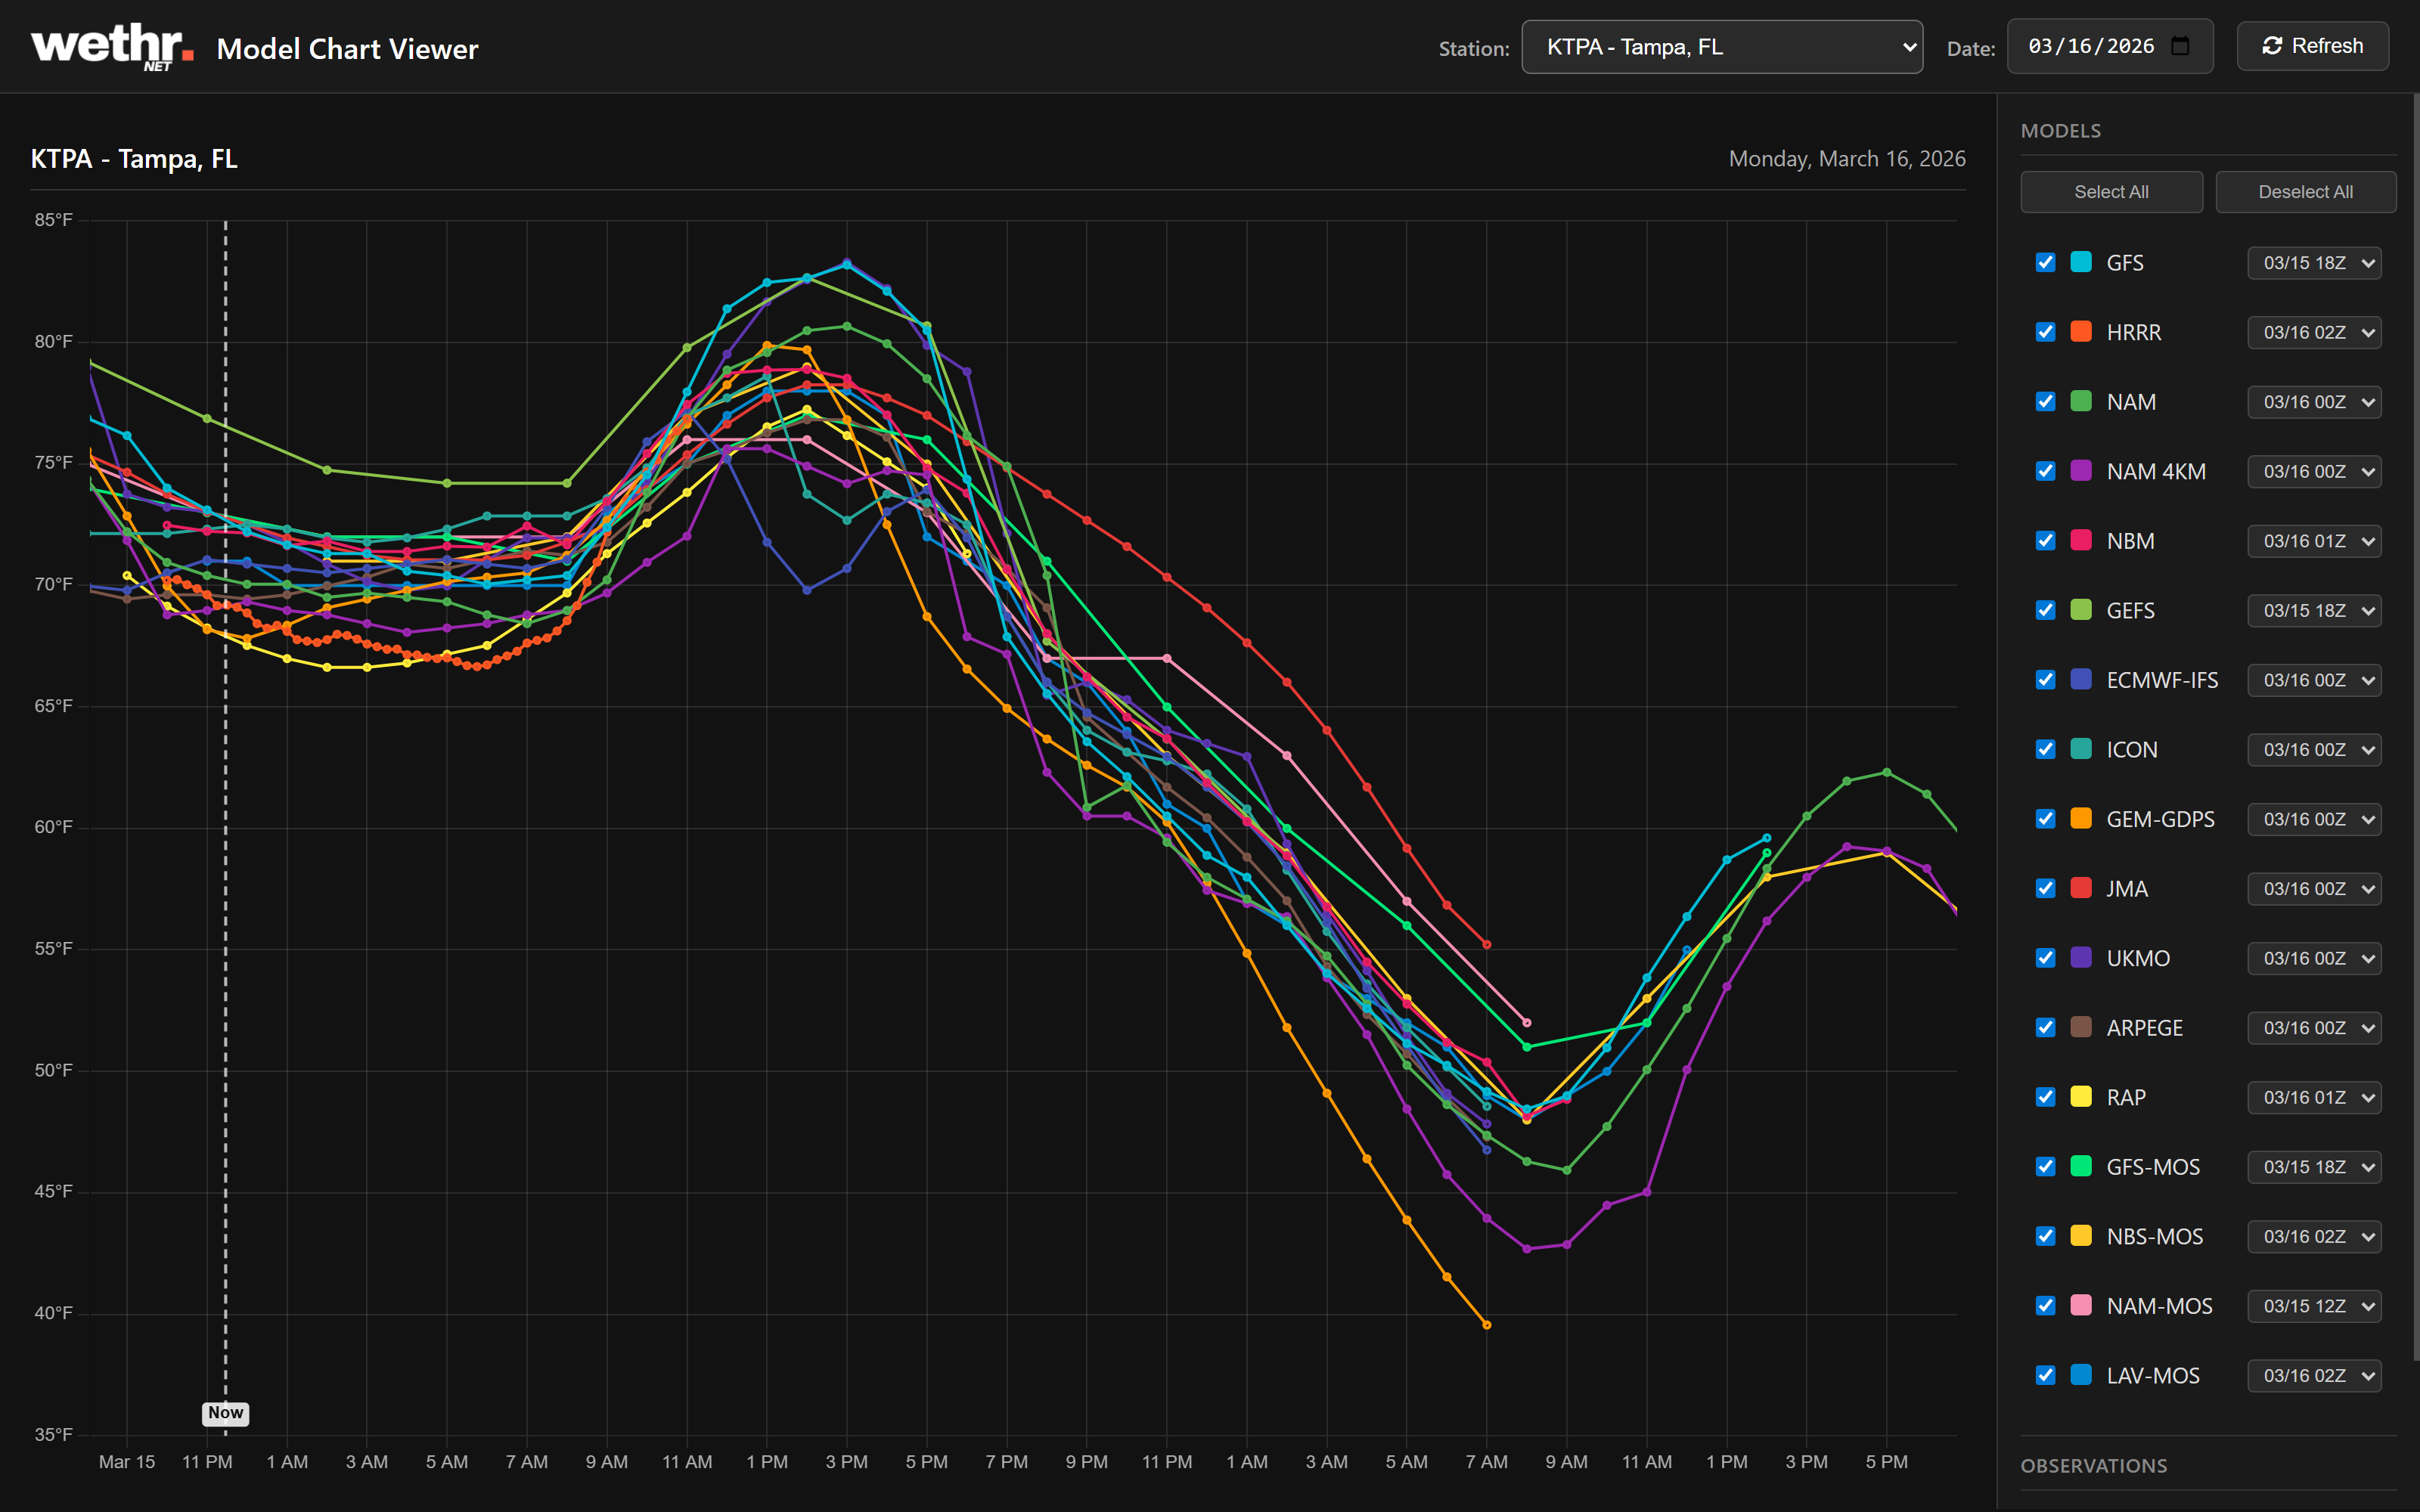
See what 15+ models predict — and how they're pacing vs reality
The Model Table shows how each forecast is pacing against live observations. The Model Chart plots forecasts and actual temps on the same chart. Open the Full-Screen Viewer to compare runs side by side.
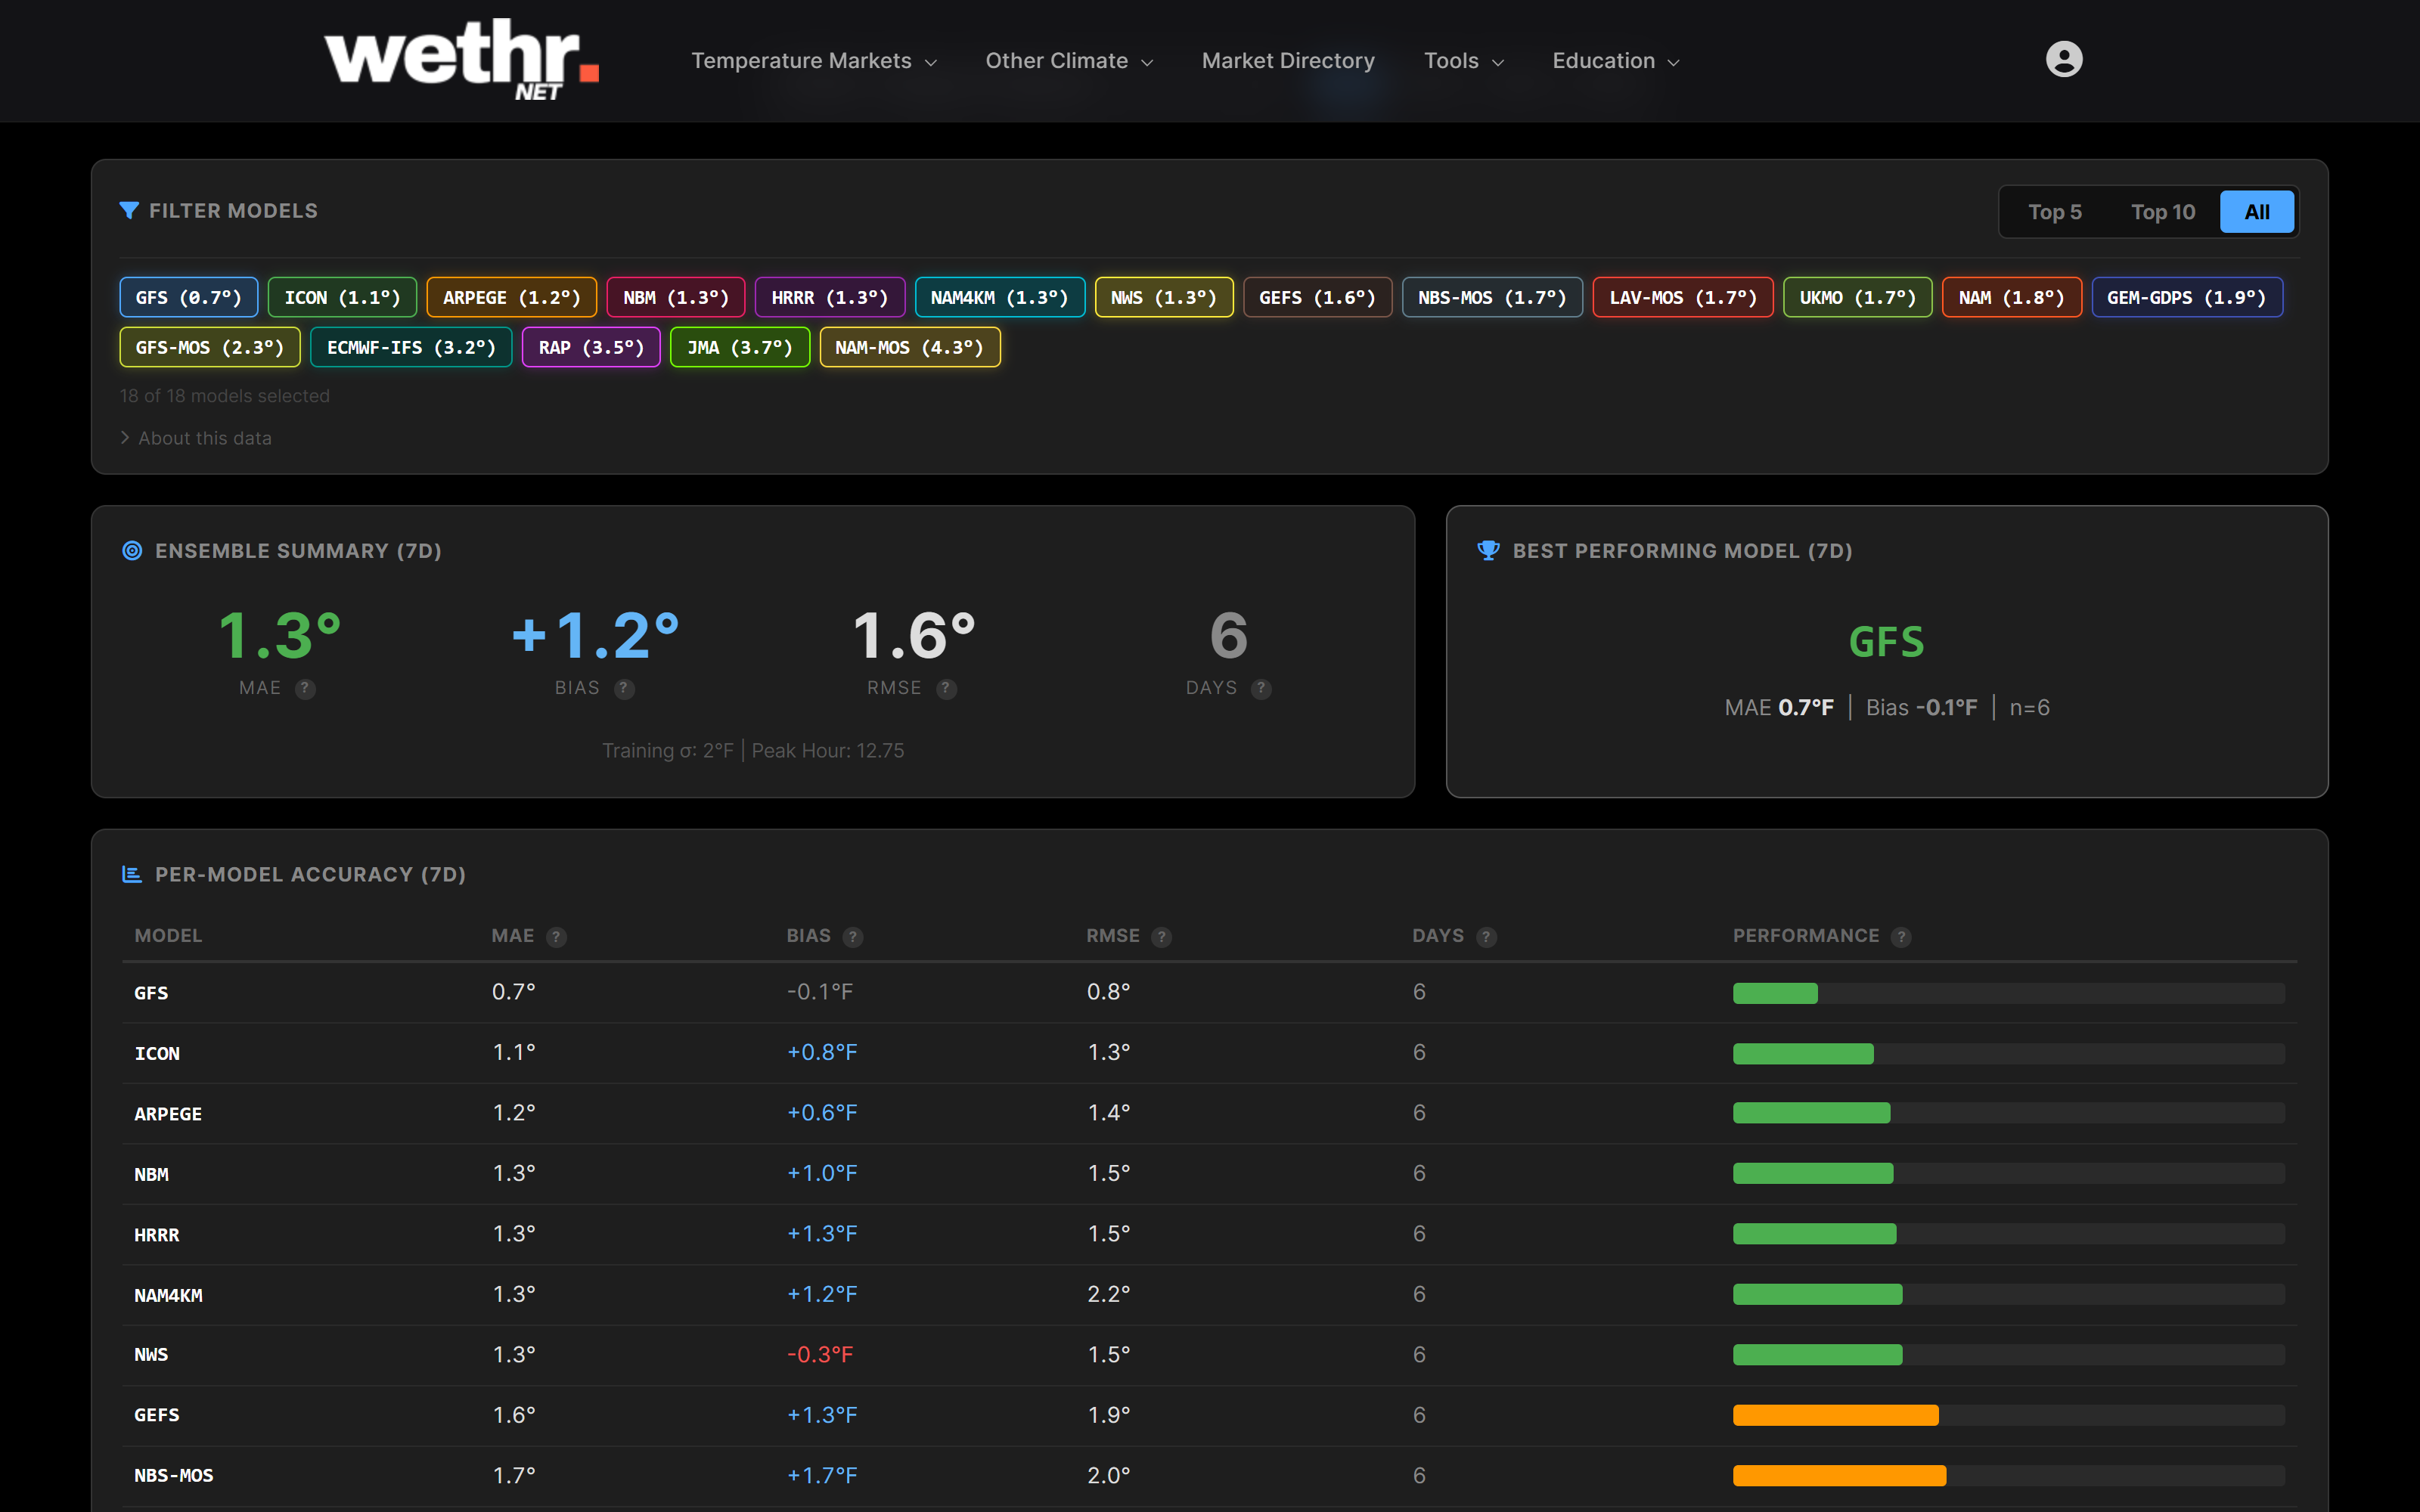
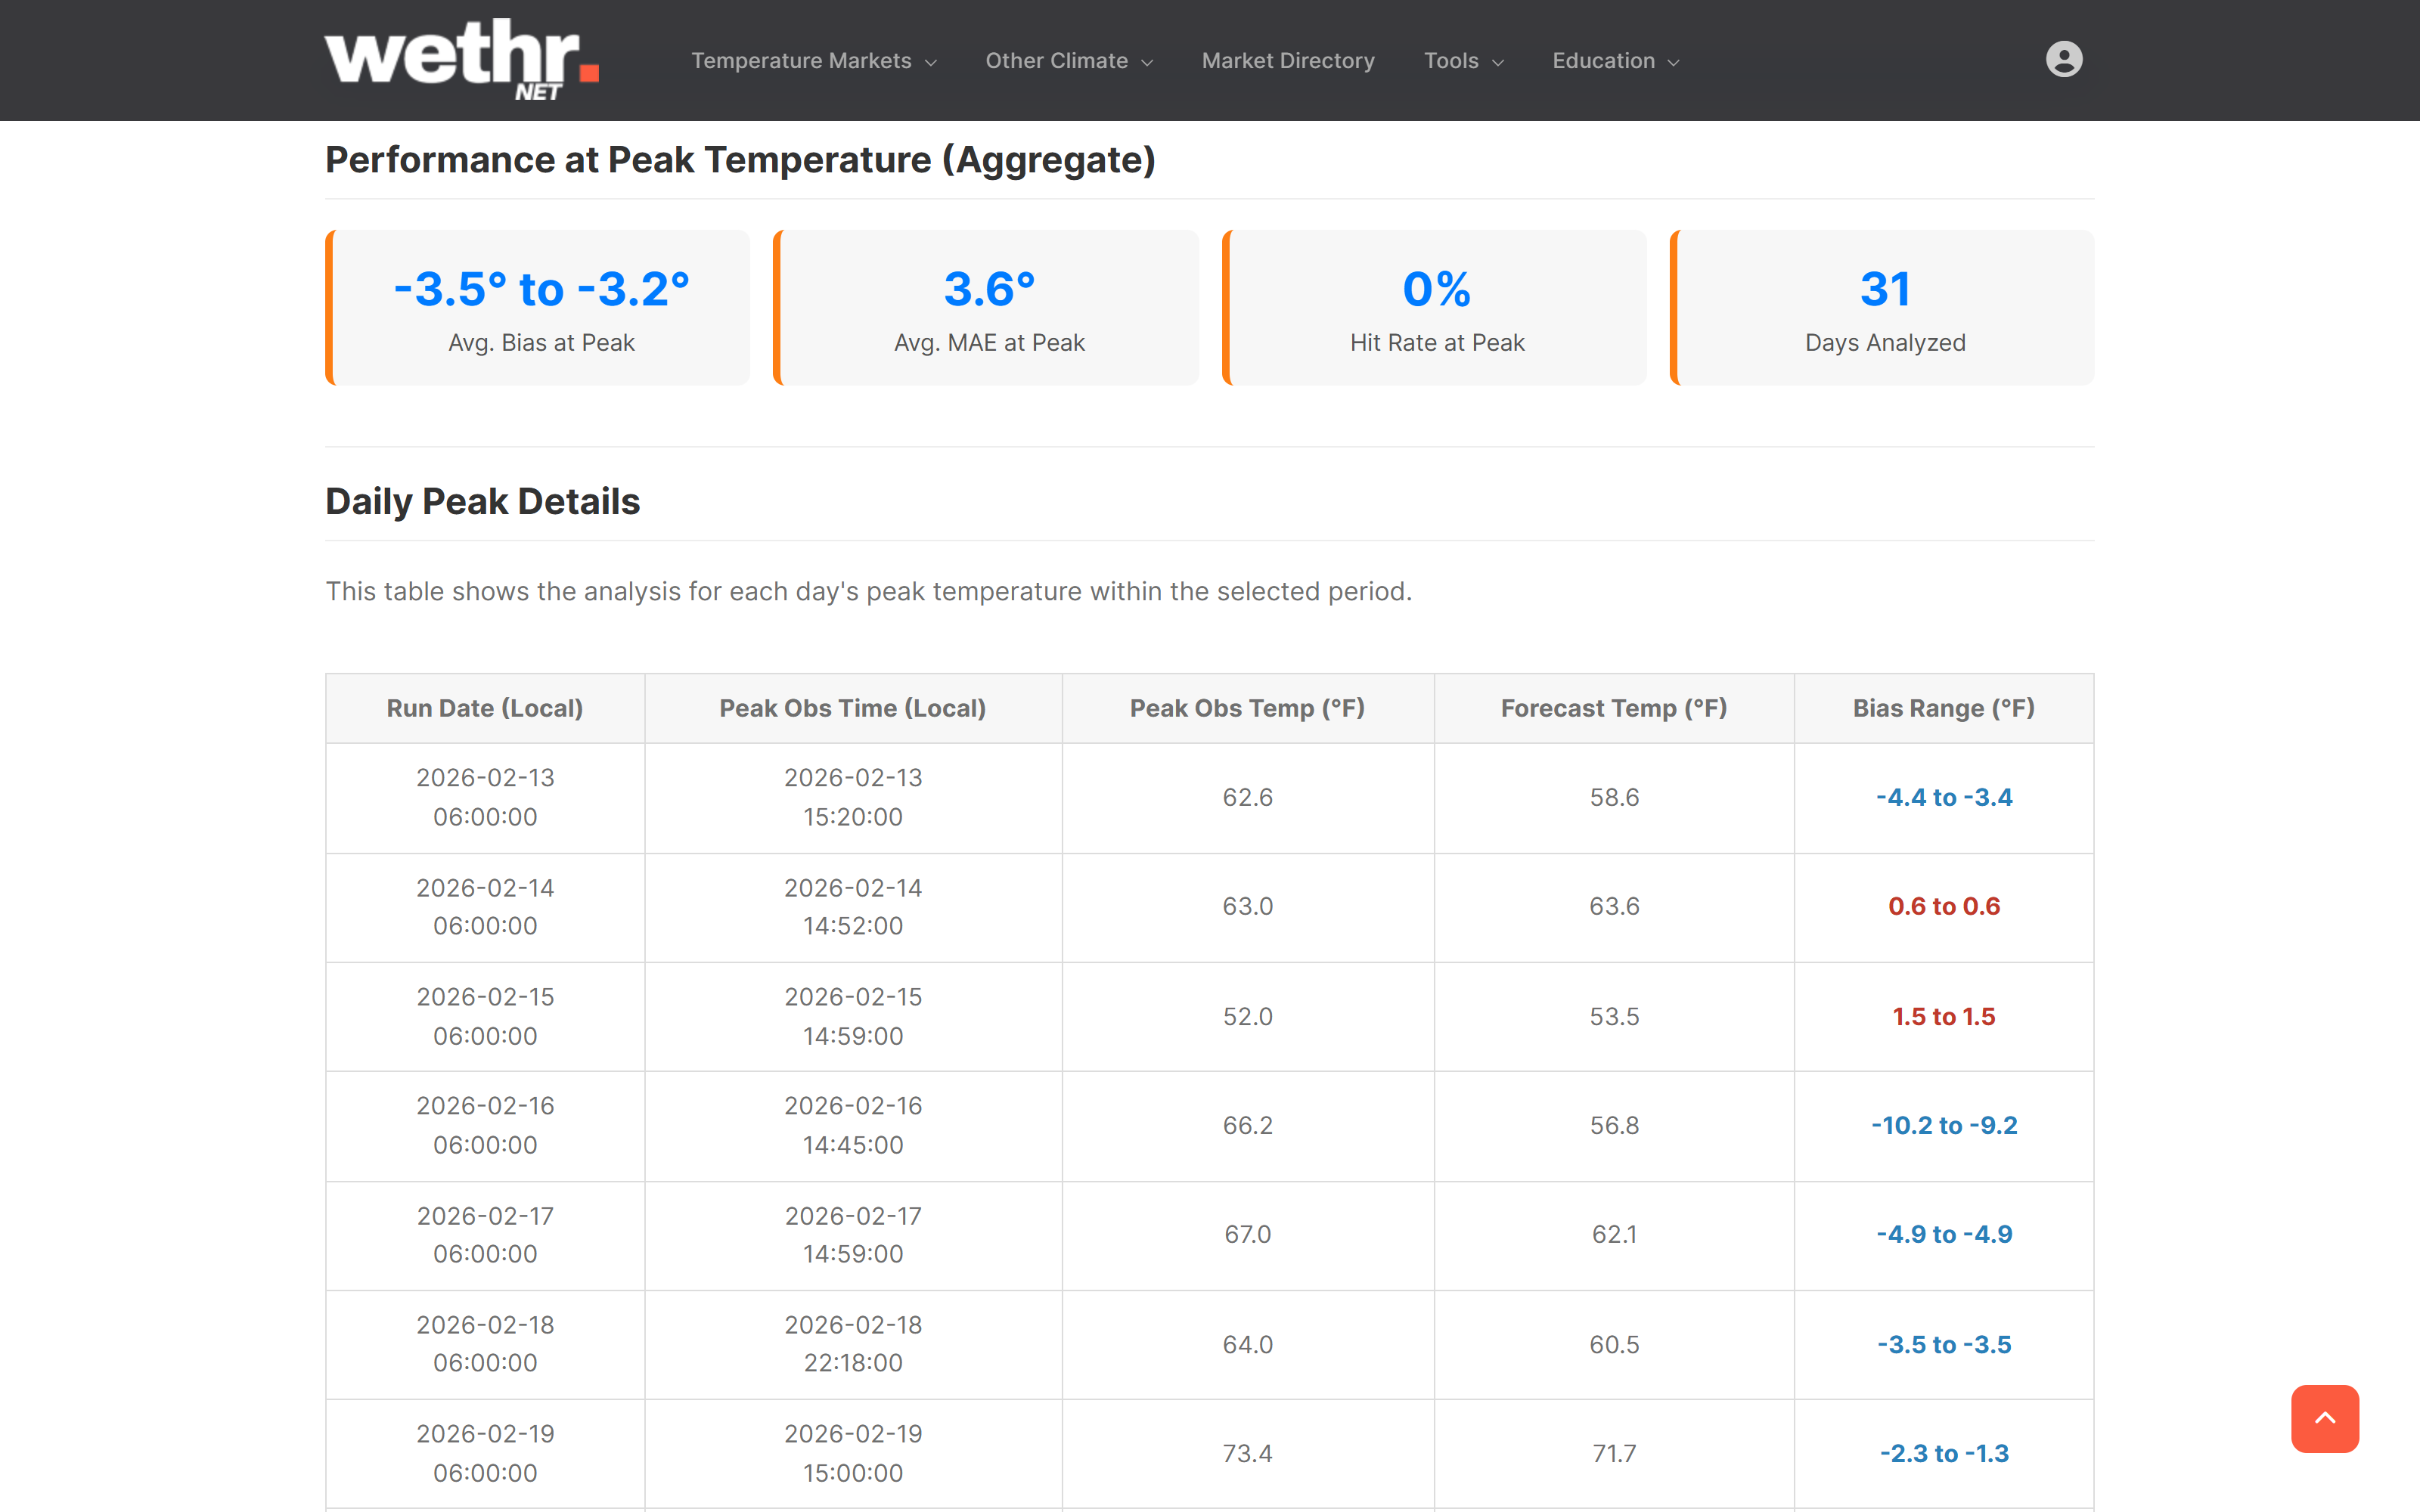
Know which models to trust — and which ones to fade
The Model Accuracy Dashboard tracks forecast accuracy and bias across 43 stations. See MAE, bias, and RMSE rankings over 7, 14, 30, or 90 days.
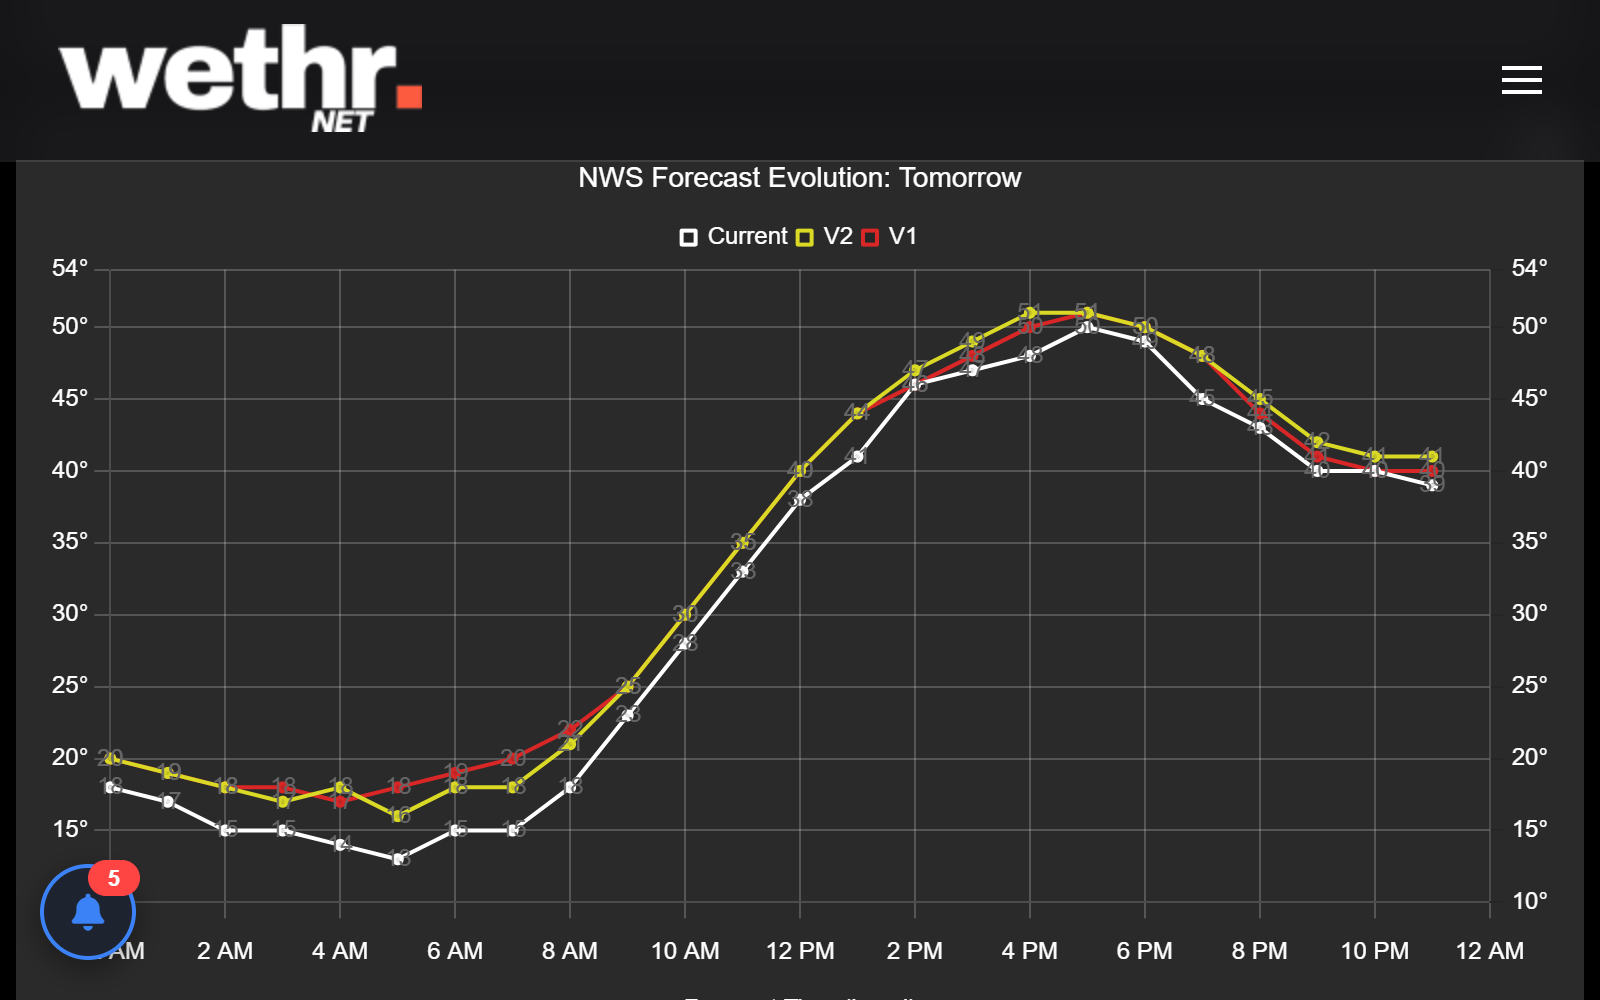
The NWS revised overnight — you see the full trend
The NWS Forecast Evolution chart tracks how the NWS forecast has changed over time. Spot warming or cooling trends across updates.
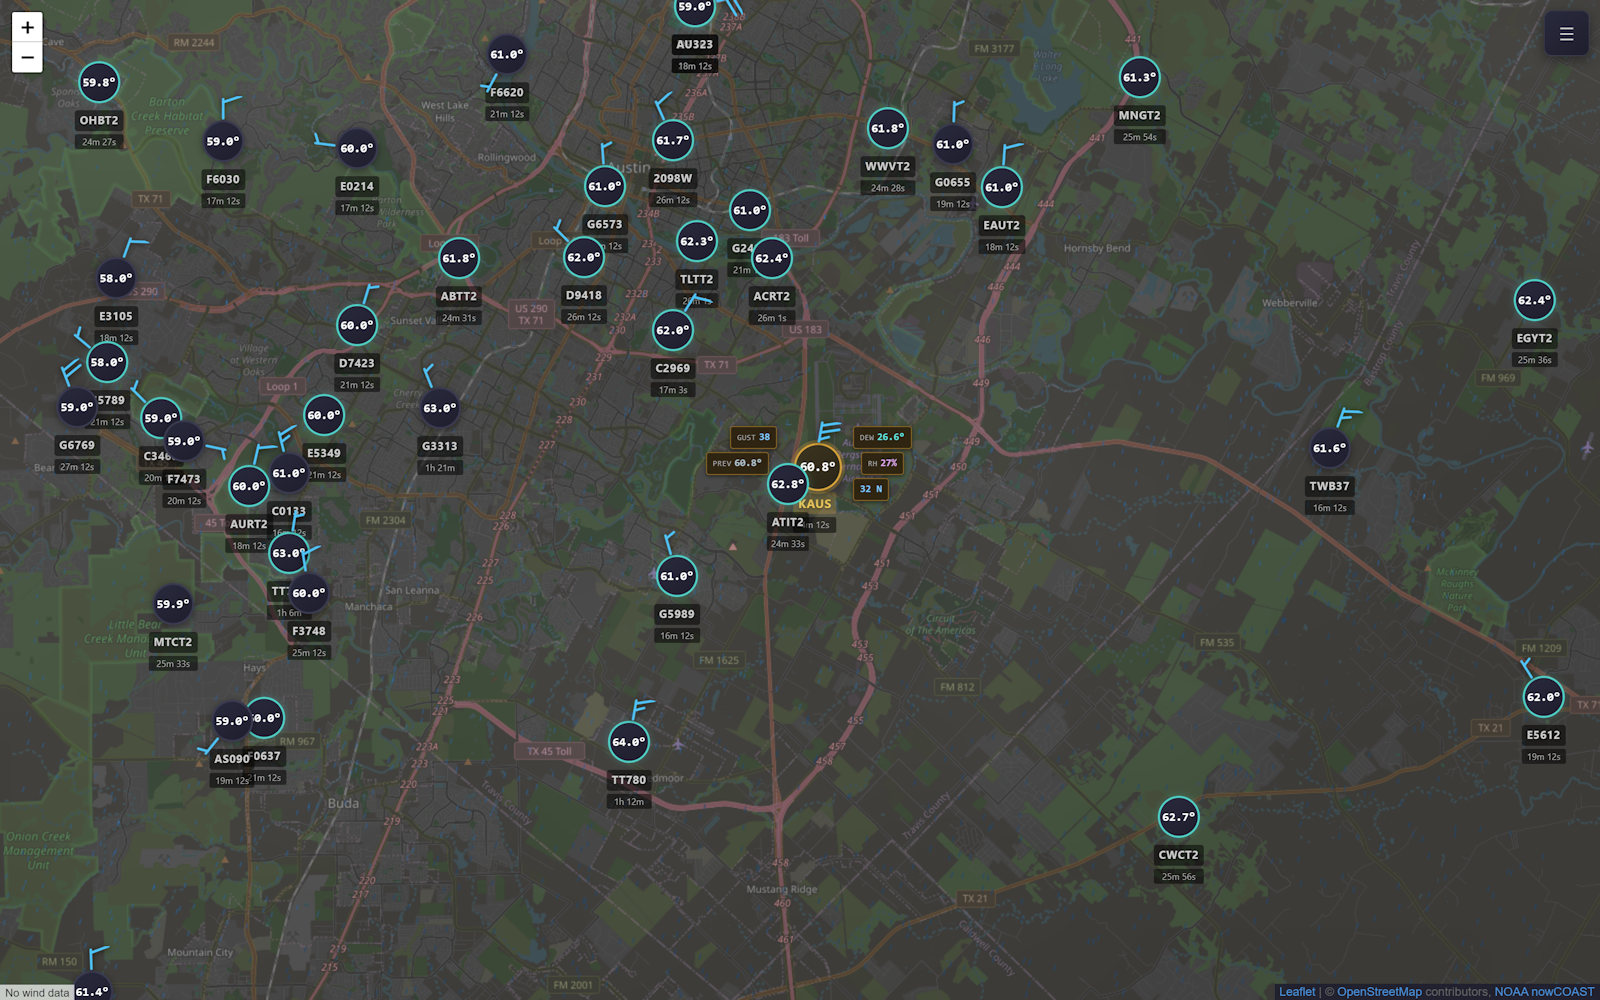
Stations 30 miles west just jumped 3°F. Yours is next.
The Neighboring Stations Map auto-refreshes with the latest observed temperatures at surrounding stations.
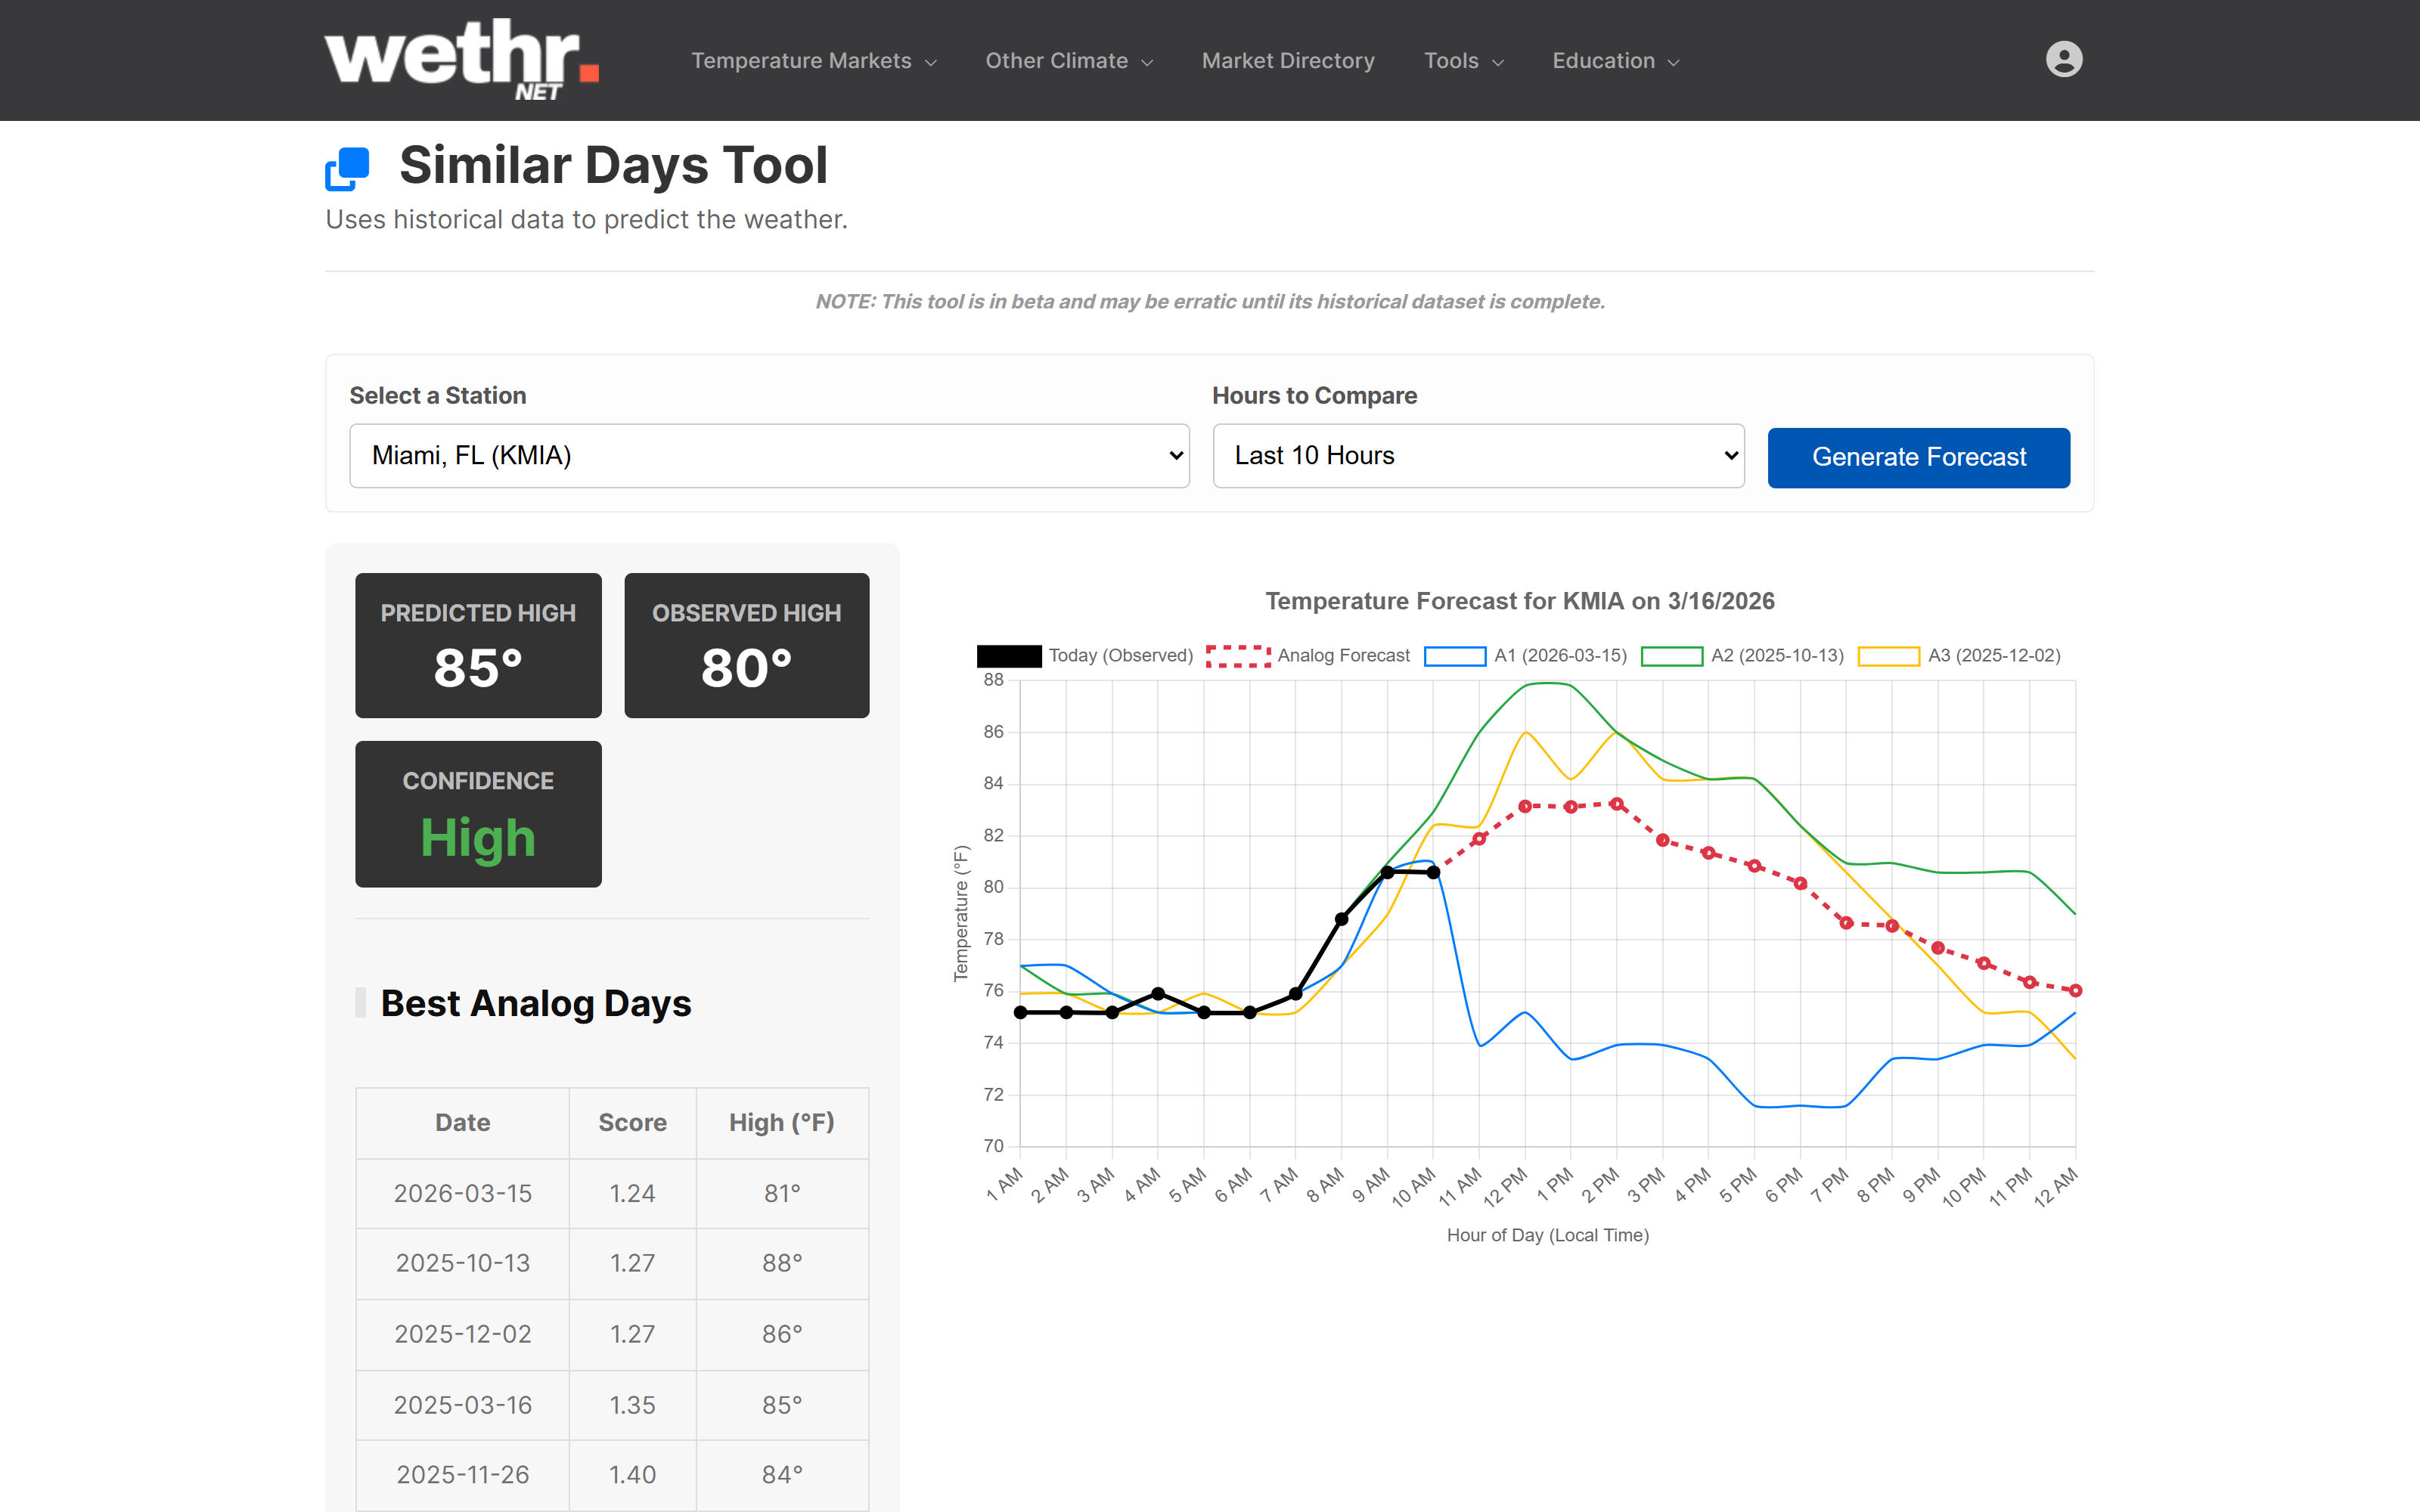
History says there's more heat coming this afternoon
The Similar Days Tool finds past days with nearly identical temperature trajectories and projects how the rest of the day will play out.
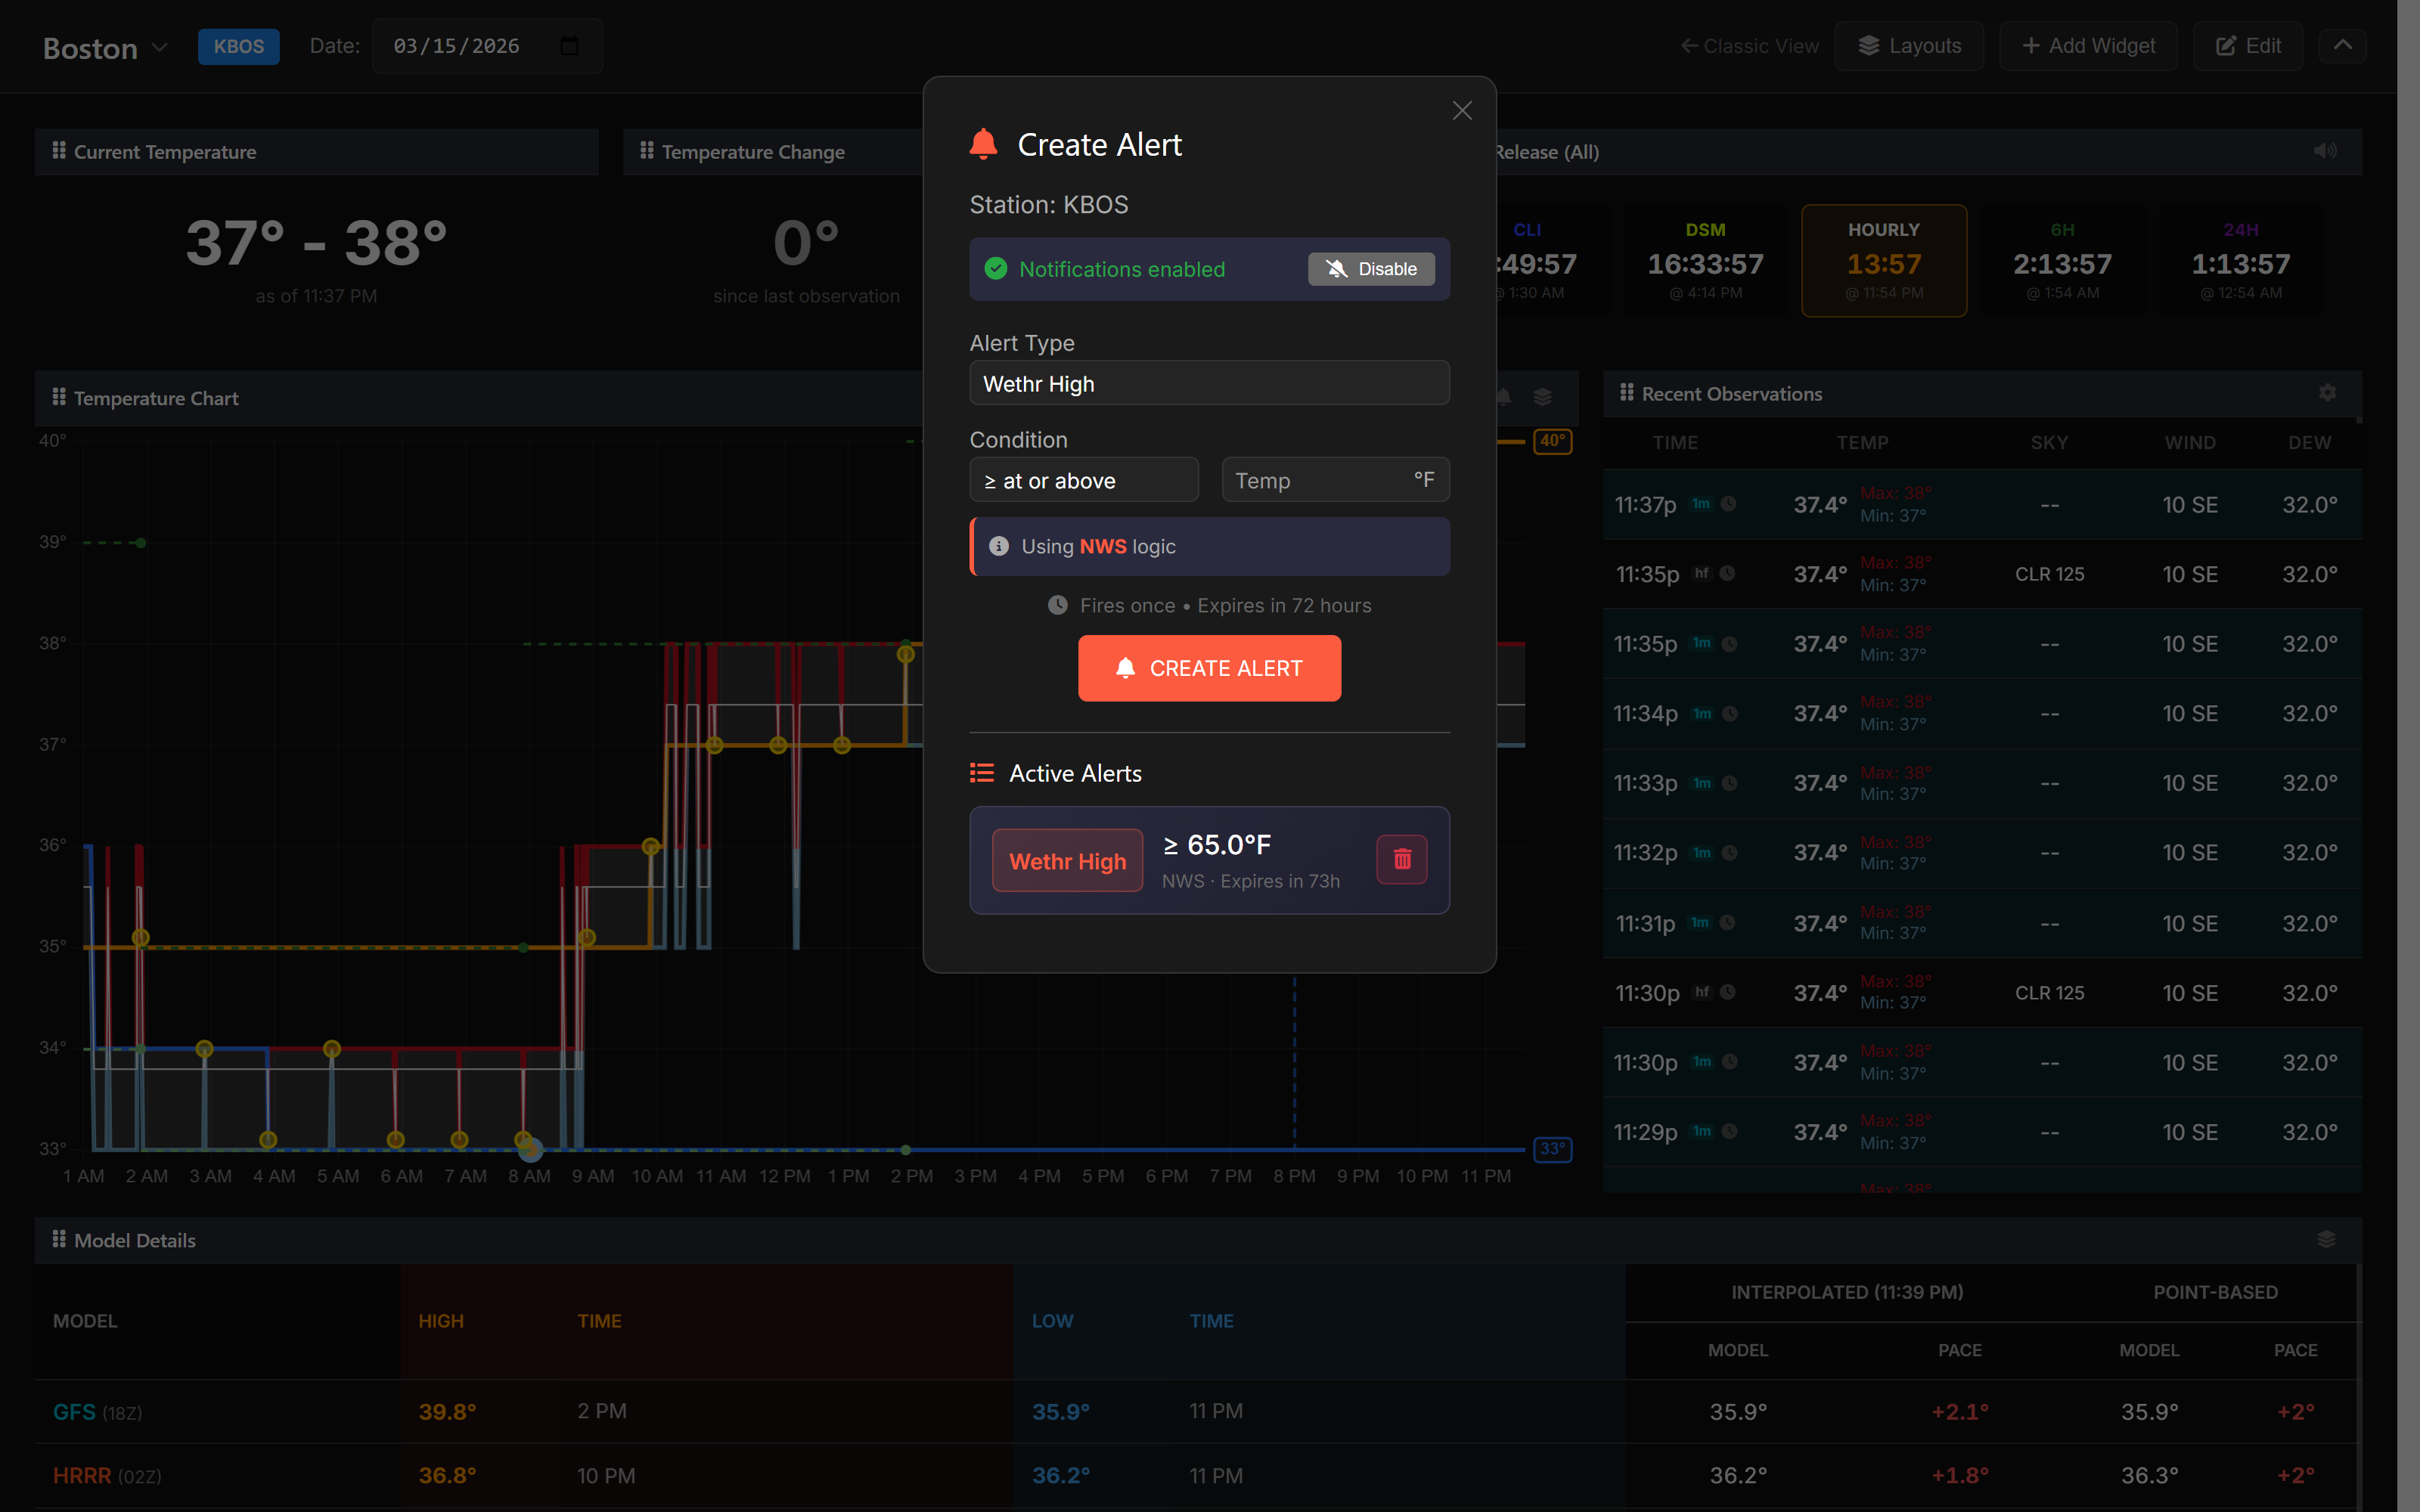
Your dashboard flags a new high. Your phone buzzes.
The High/Low Notifier widget tracks new highs and lows in NWS, WU, or both resolutions. Set custom Temperature Alerts and receive push notifications on mobile and desktop.
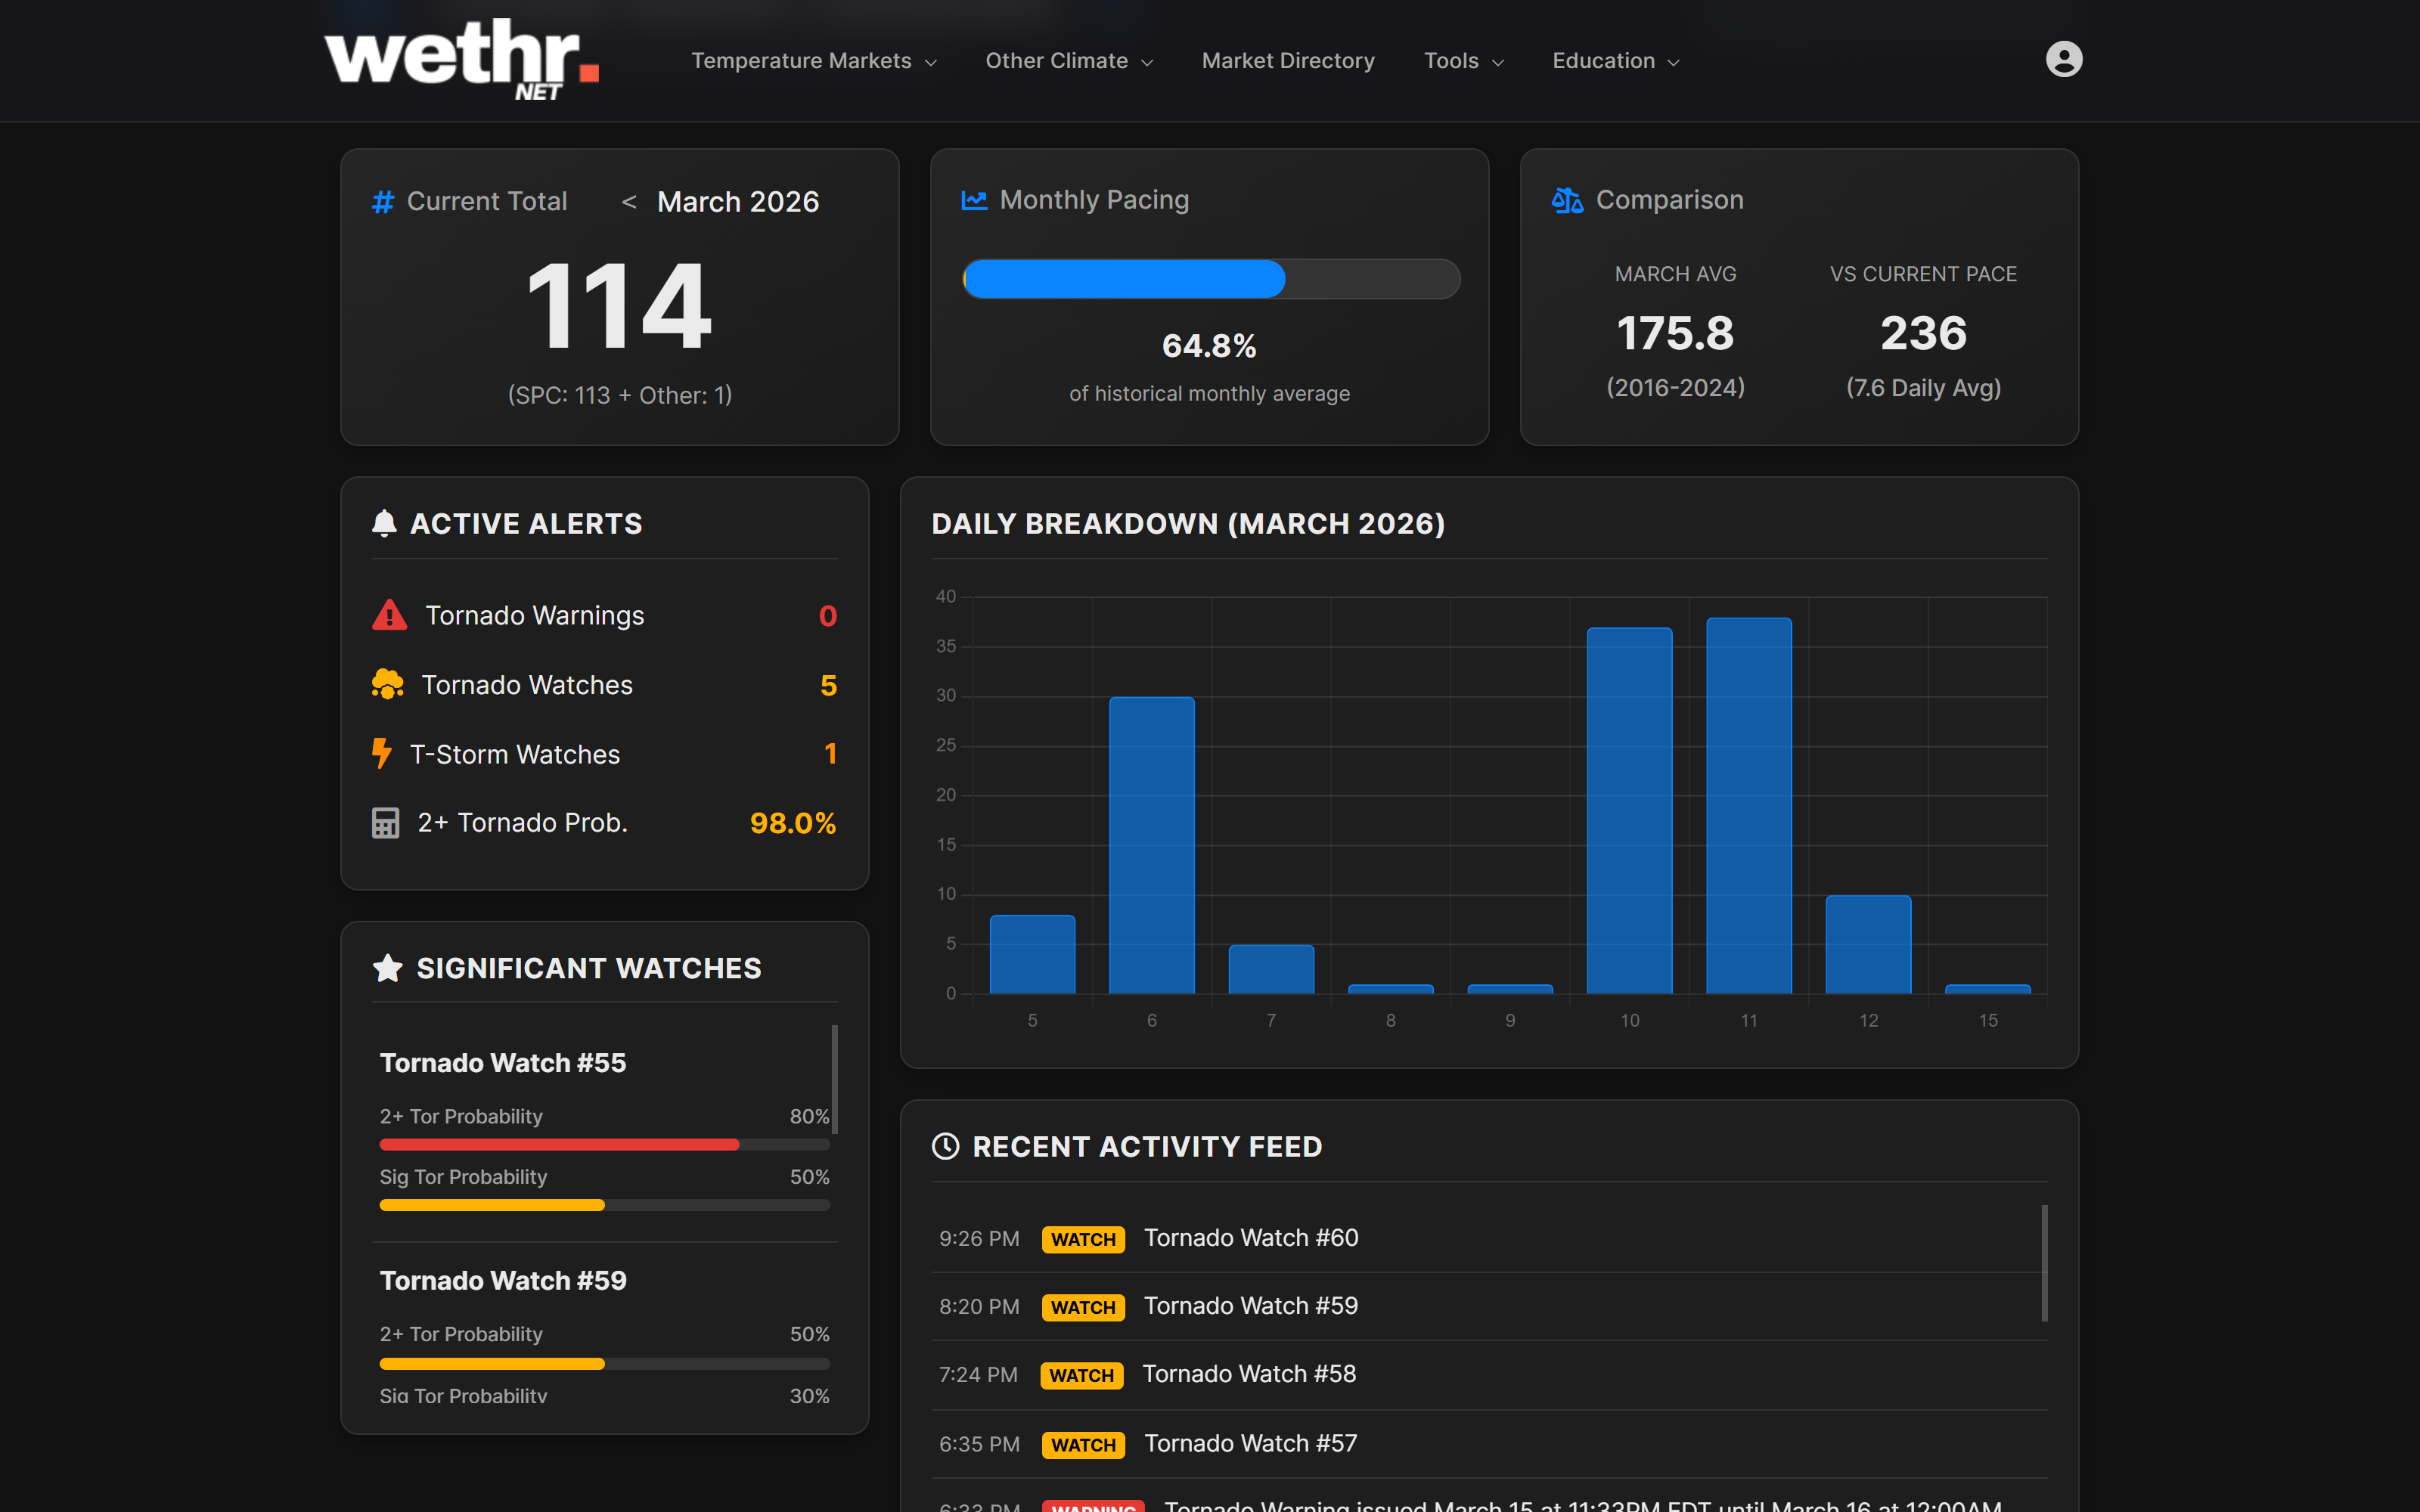
Tornado count is climbing — you're watching it live
The Tornado Dashboard shows live watch activity, a streaming LSR feed, confirmed tornado counts against market brackets, and historical context.
See accumulation hours before the official report
The Precipitation Dashboard combines official CLI totals with live 5-minute ASOS observations.
Blend models. Create corrections. Backtest everything.
The Weather Model Explorer lets you blend models at custom weights, create conditional correction profiles, and see your custom forecasts charted alongside standard models.
Pipe it all into your own tools. Get notified when it matters.
The Observations API serves Wethr Highs in NWS and WU resolution. The Forecasts API gives you data from 18 models. The Push API pings you when data changes. OMO not included; derivative data updates in real time.
?station_code=KMDW&mode=wethr_high&logic=nws
{
"wethr_high": 83,
"wethr_low": 68,
"calculation_logic": "nws"
}
Want even more power?
Developer includes everything in Professional, plus higher API limits, unlimited Push API stations, and the Model Accuracy API.
Maximum API Power
Everything in Professional, plus exclusive API endpoints, unlimited Push API stations, and 5x rate limits.
5x the rate limits. Unlimited Push API stations.
Developer gives you 300 requests/minute and 50,000 requests/day — 5x and 10x the Professional limits. The Push API unlocks subscriptions to every station on the platform.
Rate Limit 300 req/min
Daily Limit 50,000 req/day
Push API All stations (unlimited)
Accuracy API ✓ Included
Query model accuracy metrics for any station via the API
The same MAE, bias, and RMSE data that powers the Model Accuracy Dashboard — available through the Model Accuracy API for integration into your own tools.
?station=KMDW&window=14d
[{
"model": "NBM",
"mae": 1.2,
"bias": -0.3,
"rmse": 1.5
}, ...]
Start with a free account.
Upgrade when you're ready.
Every tool on this page is available on paid plans. Create a free account — no credit card required.
Plans from $14.99/mo • Compare plans